Fig. 14.
Download original image
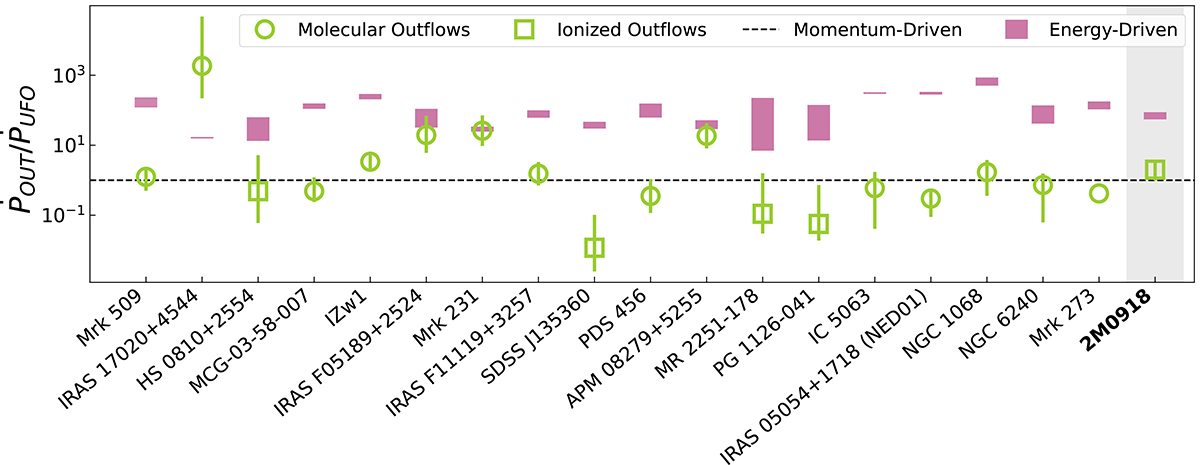
Updated figure from Bonanomi et al. (2023), first presented in Marasco et al. (2020) and Tozzi et al. (2021), with the addition of 2M0918 (gray shaded area) and Mrk 509 (Zanchettin et al. 2021). This plot contains a compilation of sources for which UFO and galaxy-scale wind energetics are available, with the large-scale winds being either ionized, molecular or atomic. The ratio of the outflow momentum rates {\dot{P}_{\mathrm{OUT}}/\dot{P}_{\mathrm{UFO}}} /ṖUFO is plotted for each source, together with values predicted from theory for momentum-driven or energy-driven scenarios. The predicted value can be estimated as the ratio VOUT/VUFO by imposing the conservation of energy, while the dashed line at ṖOUT/ṖUFO = 1 is the prediction of a momentum-driven scenario. For 2M0198, the average between the ṖOUT derived from [OIII] and Hα was used. The compilation uses various reported values (Bischetti et al. 2019; Braito et al. 2018; Chartas et al. 2009; Cicone et al. 2014; Feruglio et al. 2015, 2017; García-Burillo et al. 2014; González-Alfonso et al. 2017; Longinotti et al. 2015, 2018; Lutz et al. 2020; Marasco et al. 2020; Mizumoto et al. 2019; Reeves & Braito 2019; Rupke et al. 2017; Sirressi et al. 2019; Smith et al. 2019; Tombesi et al. 2015; Tozzi et al. 2021; Veilleux et al. 2017; Zanchettin et al. 2021).
Current usage metrics show cumulative count of Article Views (full-text article views including HTML views, PDF and ePub downloads, according to the available data) and Abstracts Views on Vision4Press platform.
Data correspond to usage on the plateform after 2015. The current usage metrics is available 48-96 hours after online publication and is updated daily on week days.
Initial download of the metrics may take a while.