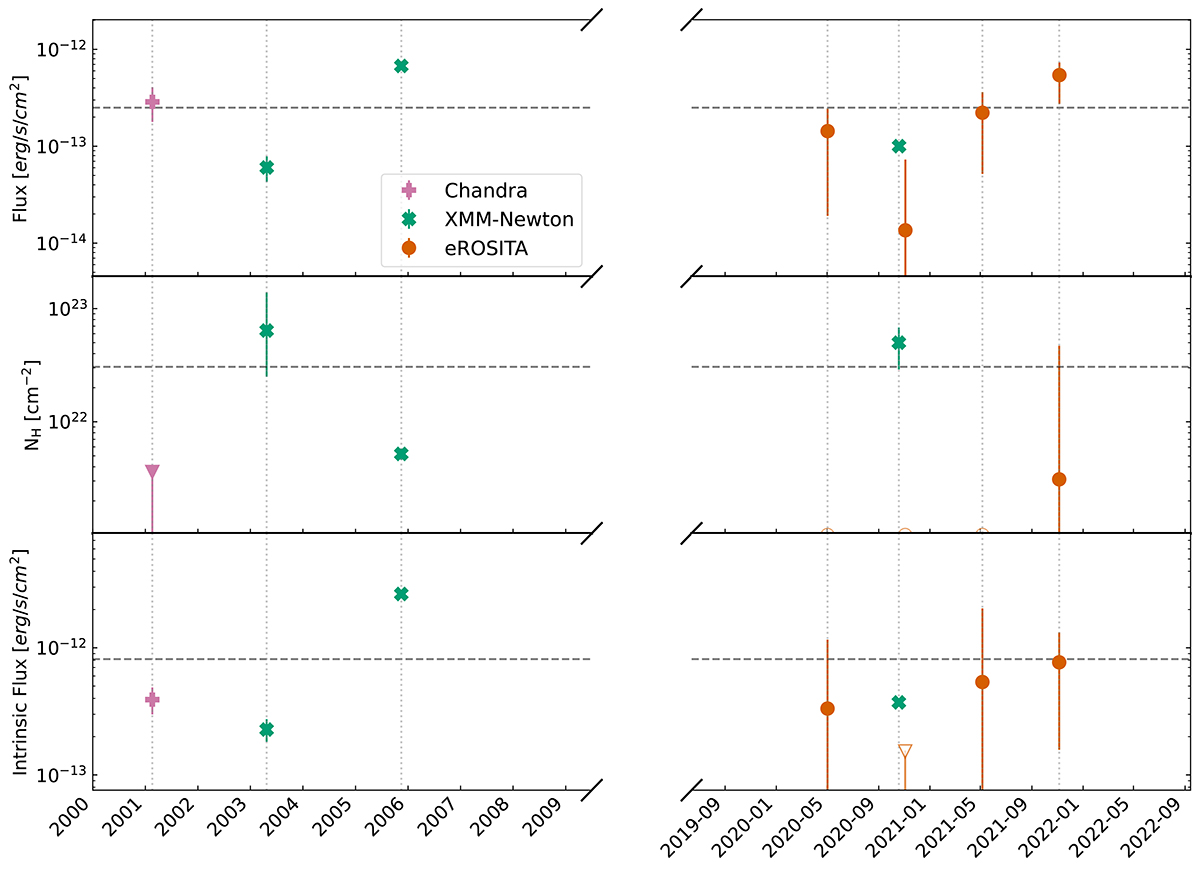
Fig. 13.
Download original image
Spectral evolution of 2M0918. Top: 0.5–2 keV observed-flux light curve. In all panels, the dashed horizontal line represents the weighted average of the y values. Middle: absorber NH over time. The red open circles correspond to eRASS 1–3, where the fit did not constrain the column density. XMM-Newton is reported as an upper limit at 90% confidence. A clear anticorrelation with flux is noticeable when NH is compared with the evolution in the top panel. Bottom: intrinsic flux light curve. eRASS2 was only constrained as an upper limit.
Current usage metrics show cumulative count of Article Views (full-text article views including HTML views, PDF and ePub downloads, according to the available data) and Abstracts Views on Vision4Press platform.
Data correspond to usage on the plateform after 2015. The current usage metrics is available 48-96 hours after online publication and is updated daily on week days.
Initial download of the metrics may take a while.