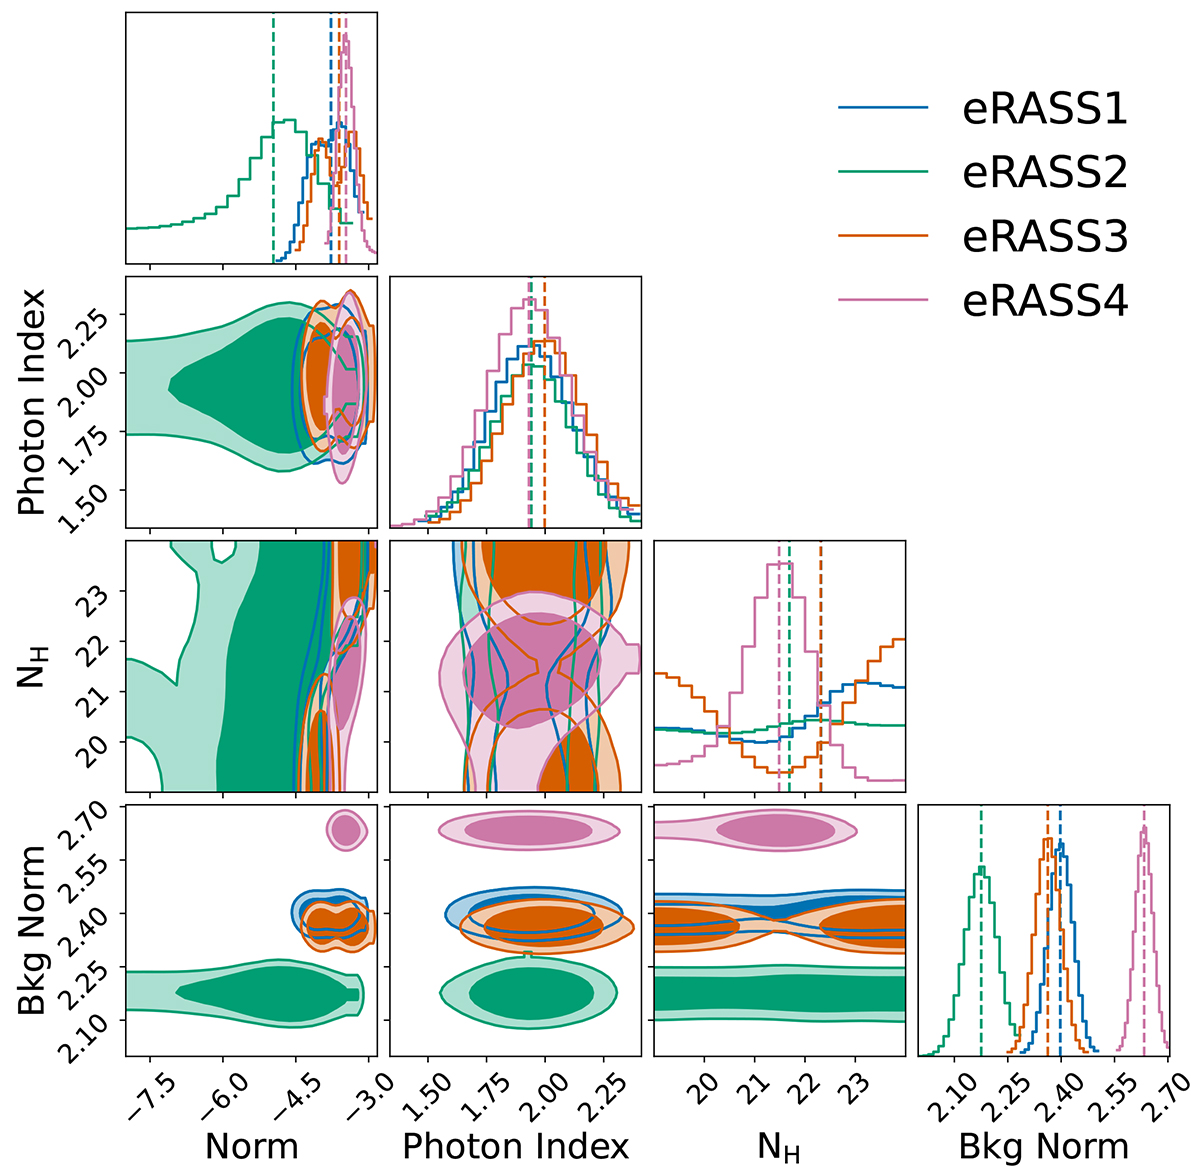
Fig. 12.
Download original image
Cornerplot of the fitted parameters (power-law normalization, photon index, column density, and background normalization) for the eROSITA observations. The histograms represent the individual parameter posterior distributions, while the shaded contours show the credibility regions of the interception of different parameters. The darker shades correspond to 68% of the integrated posterior, and the lighter shades to 90%. The color-coding is the same as in Fig. 11.
Current usage metrics show cumulative count of Article Views (full-text article views including HTML views, PDF and ePub downloads, according to the available data) and Abstracts Views on Vision4Press platform.
Data correspond to usage on the plateform after 2015. The current usage metrics is available 48-96 hours after online publication and is updated daily on week days.
Initial download of the metrics may take a while.