Open Access
Fig. 11.
Download original image
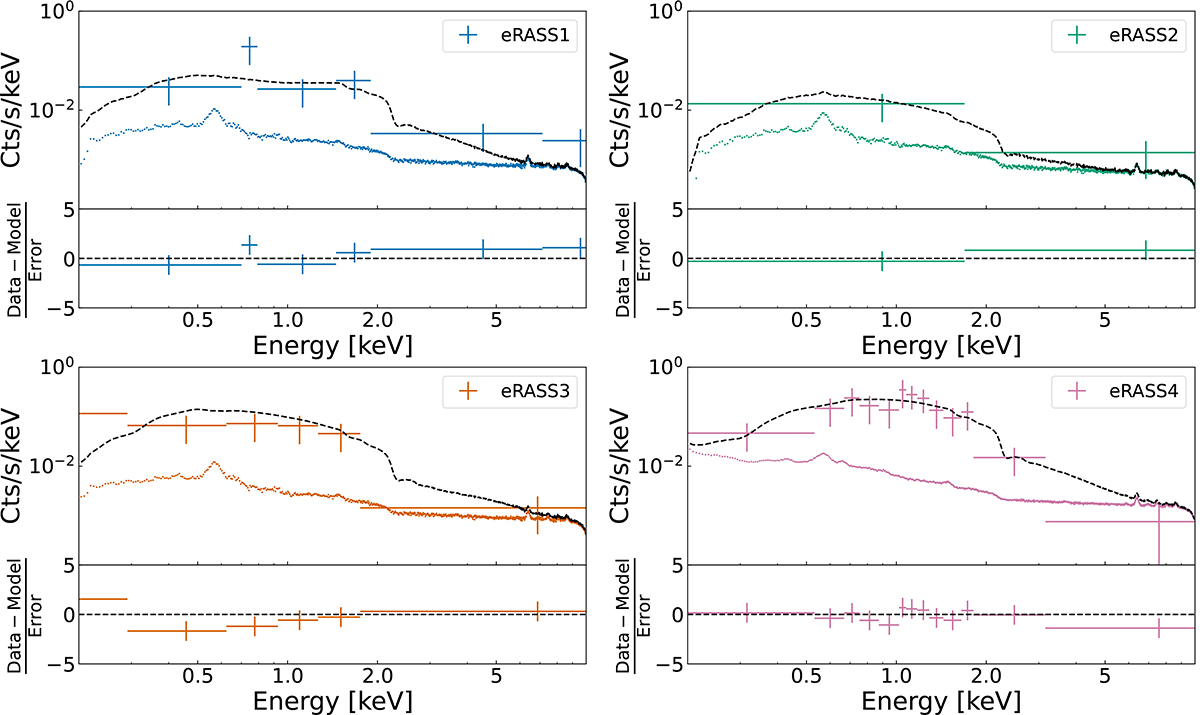
Spectra and residuals of the four eROSITA observations. The spectra are binned for visualization purposes. In the same color as the spectra, the PCA background model is shown for each observation, while the dashed lines show the best-fit model for each eRASS. There is a drastic photon drop in eRASS2 and a rise in eRASS4.
Current usage metrics show cumulative count of Article Views (full-text article views including HTML views, PDF and ePub downloads, according to the available data) and Abstracts Views on Vision4Press platform.
Data correspond to usage on the plateform after 2015. The current usage metrics is available 48-96 hours after online publication and is updated daily on week days.
Initial download of the metrics may take a while.