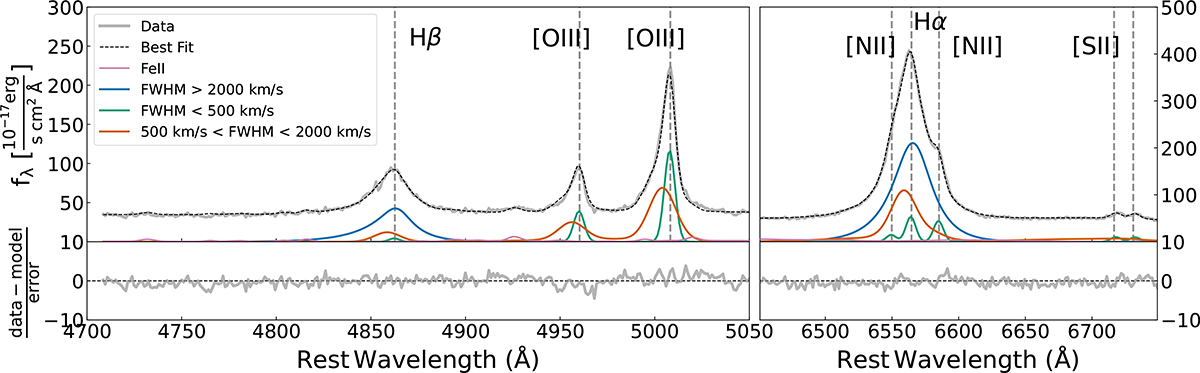
Fig. 1.
Download original image
Best-fit model of the Hβ and Hα complexes. The original dataset is in gray, the total line emission is the dashed black line, and the FeII contribution is the pink curve. The colored lines represent the multiple emission line components described in the text (see legend in inset). The orange Gaussian lines clearly reveal the presence of a blueshifted component.
Current usage metrics show cumulative count of Article Views (full-text article views including HTML views, PDF and ePub downloads, according to the available data) and Abstracts Views on Vision4Press platform.
Data correspond to usage on the plateform after 2015. The current usage metrics is available 48-96 hours after online publication and is updated daily on week days.
Initial download of the metrics may take a while.