Fig. 8.
Download original image
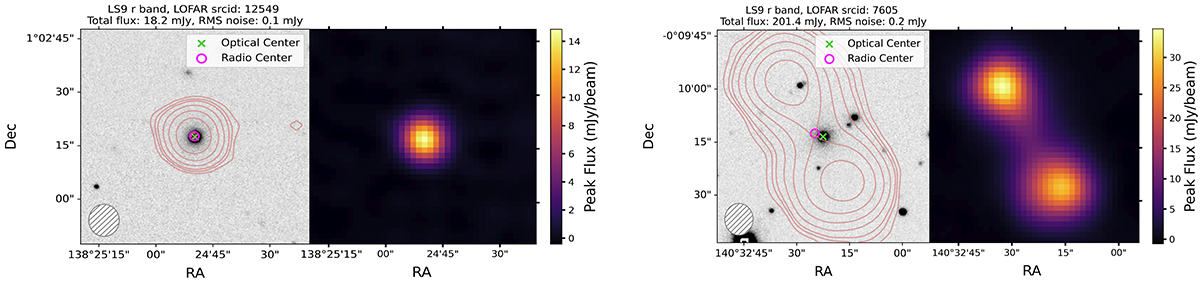
Cutouts (60″ × 60″) showing prototypical compact (left) and complex (right) radio morphologies with light red contours marking several factors of the local noise (at rms × [2, 4, 6, 12, 24, 48]) and magenta circles indicating the radio centres. The beam size is depicted as a hatch-filled circle in the bottom left corner. In grey scale, the LS9 r-band image depicts the host galaxy, with its optical centre marked with a green cross. Radio intensity maps, with a colour bar indicating the peak flux, are also shown for these two examples.
Current usage metrics show cumulative count of Article Views (full-text article views including HTML views, PDF and ePub downloads, according to the available data) and Abstracts Views on Vision4Press platform.
Data correspond to usage on the plateform after 2015. The current usage metrics is available 48-96 hours after online publication and is updated daily on week days.
Initial download of the metrics may take a while.