Fig. 7.
Download original image
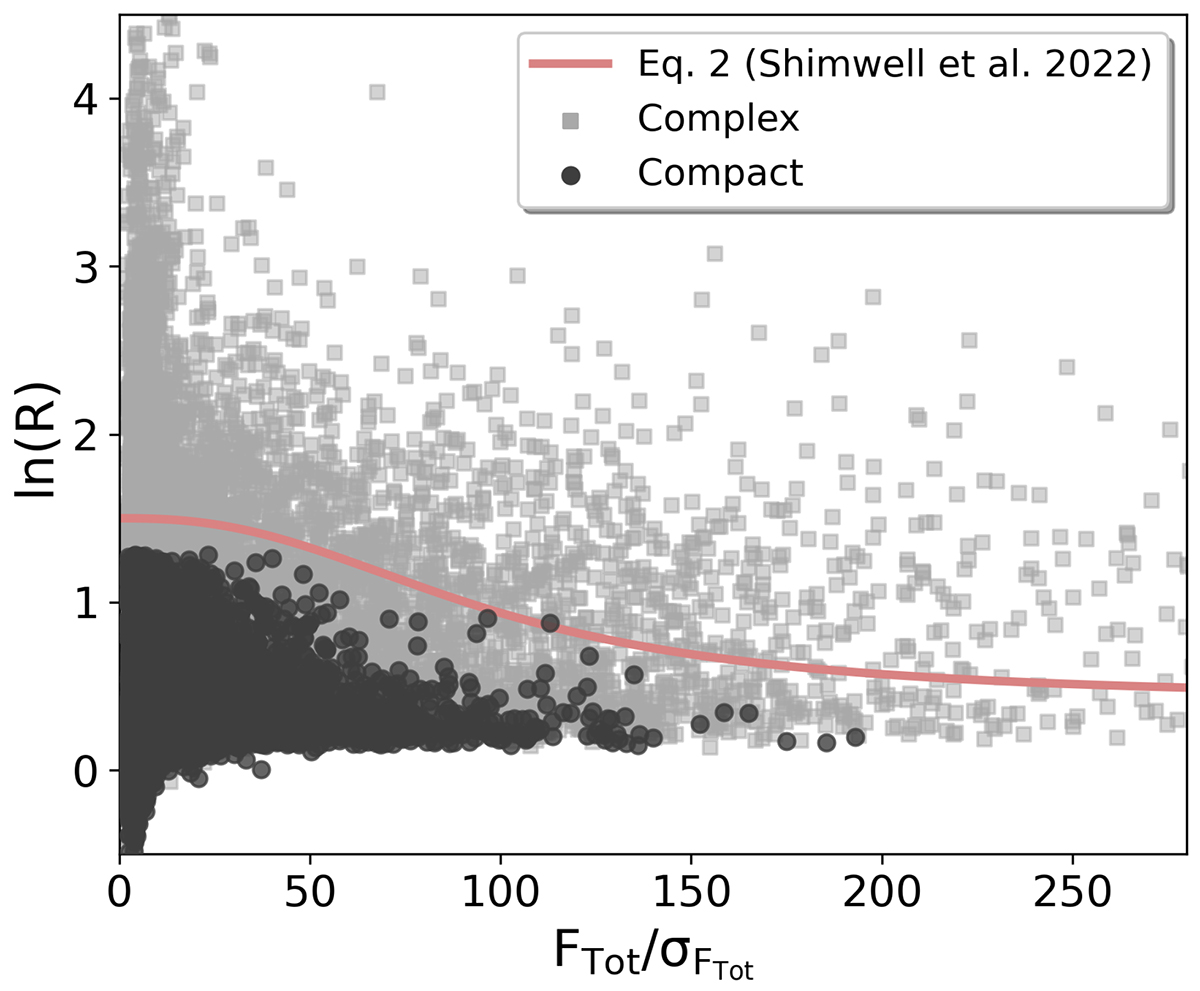
Signal-to-noise ratio versus the logarithm of the ratio of total to peak fluxes for the LOFAR sample of 36 631 sources. S/N is calculated here by dividing the total radio flux by its associated error. Sources classified as compact are shown in black, complex ones in light grey. The light red curve is taken from Shimwell et al. (2022, Eq. (2)), below which 99.9% of all compact or unresolved sources lie.
Current usage metrics show cumulative count of Article Views (full-text article views including HTML views, PDF and ePub downloads, according to the available data) and Abstracts Views on Vision4Press platform.
Data correspond to usage on the plateform after 2015. The current usage metrics is available 48-96 hours after online publication and is updated daily on week days.
Initial download of the metrics may take a while.