Fig. 6.
Download original image
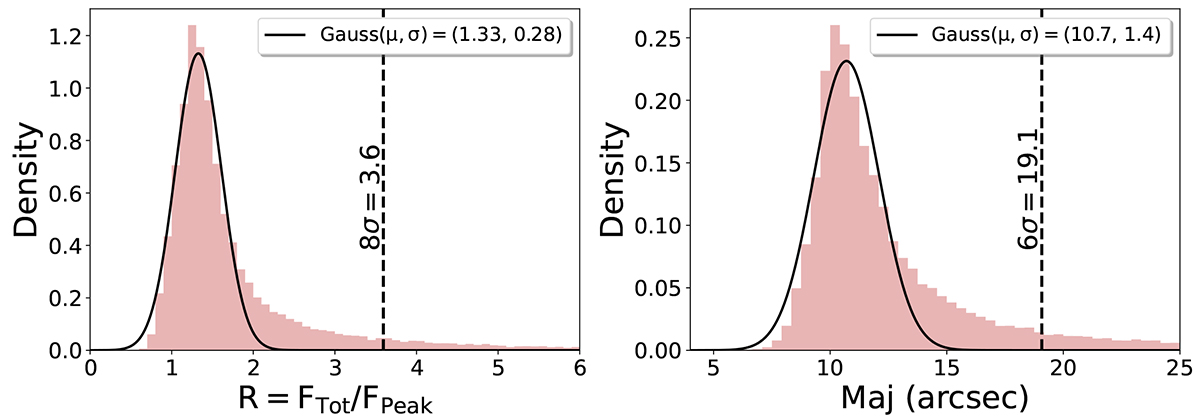
Histograms showing the flux ratio (total to peak flux; left) and major axis (right) distributions for the LOFAR sample of 36 631 sources in the eFEDS field, each fit by a Gaussian (black curves) to determine the thresholds for being a compact radio emitter. These are shown as black dashed vertical lines (see text for more details).
Current usage metrics show cumulative count of Article Views (full-text article views including HTML views, PDF and ePub downloads, according to the available data) and Abstracts Views on Vision4Press platform.
Data correspond to usage on the plateform after 2015. The current usage metrics is available 48-96 hours after online publication and is updated daily on week days.
Initial download of the metrics may take a while.