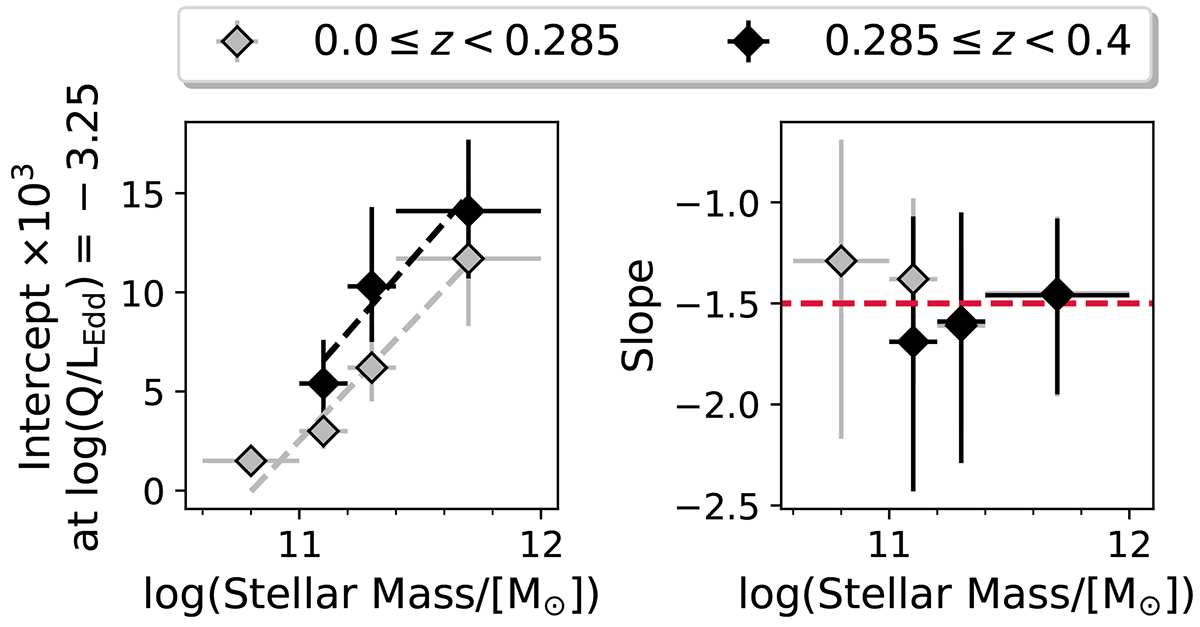
Fig. 20.
Download original image
Results of a power law fit, y = A × (10x − x0)B, to all the different mass, redshift bins present in Fig. 19. The left panel plots the normalisation (A * 103) as the y-intercept at x = x0 = −3.25; the right panel plots the slope (B). The slope is consistently around −1.5 for all M* values (red dashed line). The normalisations show a slight mass dependence of the incidence, with some redshift evolution. Light grey and black dashed lines show the result from a linear fit (parameters listed in Table 3).
Current usage metrics show cumulative count of Article Views (full-text article views including HTML views, PDF and ePub downloads, according to the available data) and Abstracts Views on Vision4Press platform.
Data correspond to usage on the plateform after 2015. The current usage metrics is available 48-96 hours after online publication and is updated daily on week days.
Initial download of the metrics may take a while.