Fig. 10.
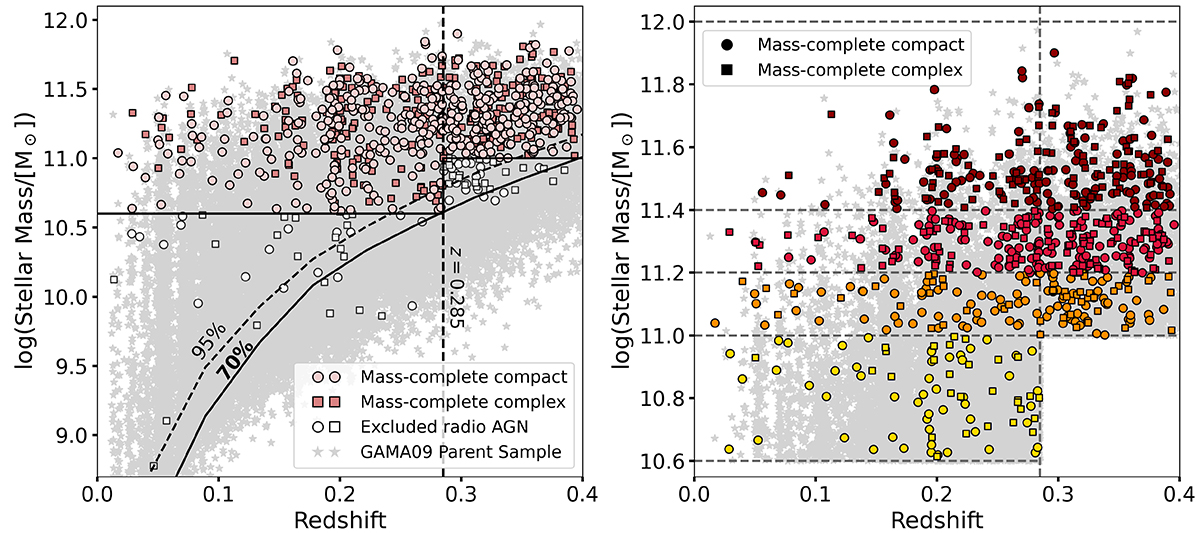
Download original image
Stellar mass versus redshift distribution for the GAMA09 galaxies (grey points) and for the compact (light filled circles) and complex (dark filled squares) radio AGN. A vertical line divides the sample into two redshift bins. Completeness curves (70%, 95% with solid, dashed black lines, respectively) and horizontal thresholds are used to exclude sources incomplete in stellar mass (unfilled markers). A zoom-in of the mass-complete sample, split into four stellar mass bins (yellow, orange, red, crimson), is presented in the right panel.
Current usage metrics show cumulative count of Article Views (full-text article views including HTML views, PDF and ePub downloads, according to the available data) and Abstracts Views on Vision4Press platform.
Data correspond to usage on the plateform after 2015. The current usage metrics is available 48-96 hours after online publication and is updated daily on week days.
Initial download of the metrics may take a while.