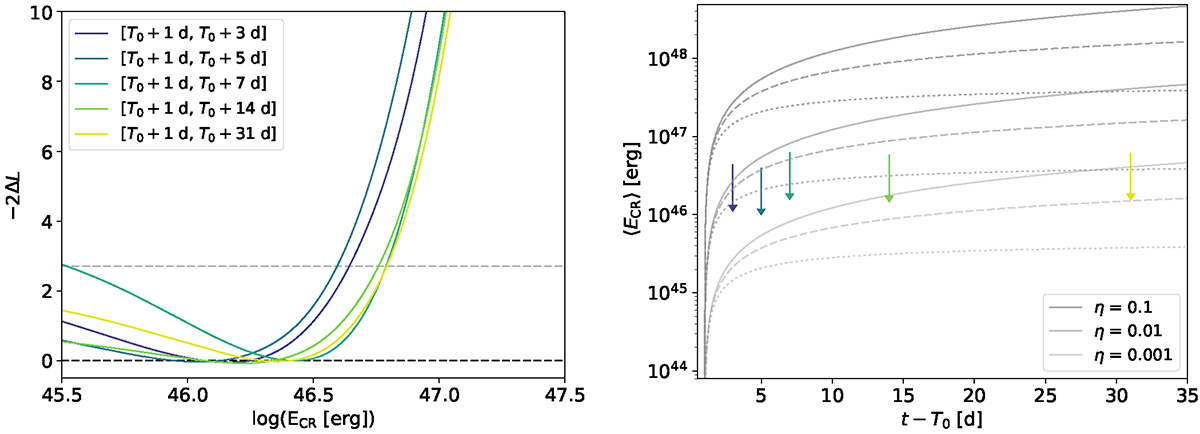
Fig. 8.
Download original image
Limits for a steady-wind profile. Left: likelihood profiles for different exposures considering the average density derived from a ρw steady-wind profile with m = 1, rescaling Fig. 7, right panel. Right: limits on the average cumulated total CR energy ⟨ECR⟩ for different exposure times ΔT. ⟨ECR⟩ is computed for different efficiencies η and velocity profiles with m = 1 (solid line), m = 0.83 (dashed line, as for SN 1993J), and m = 0.5 (dotted line) using ṀRSG = 10−2 M⊙ yr−1 and uw = 100 km s−1. For visualisation purposes, Fermi-LAT limits are only plotted for m = 1. Colours represent the same exposures as in Fig. 7.
Current usage metrics show cumulative count of Article Views (full-text article views including HTML views, PDF and ePub downloads, according to the available data) and Abstracts Views on Vision4Press platform.
Data correspond to usage on the plateform after 2015. The current usage metrics is available 48-96 hours after online publication and is updated daily on week days.
Initial download of the metrics may take a while.