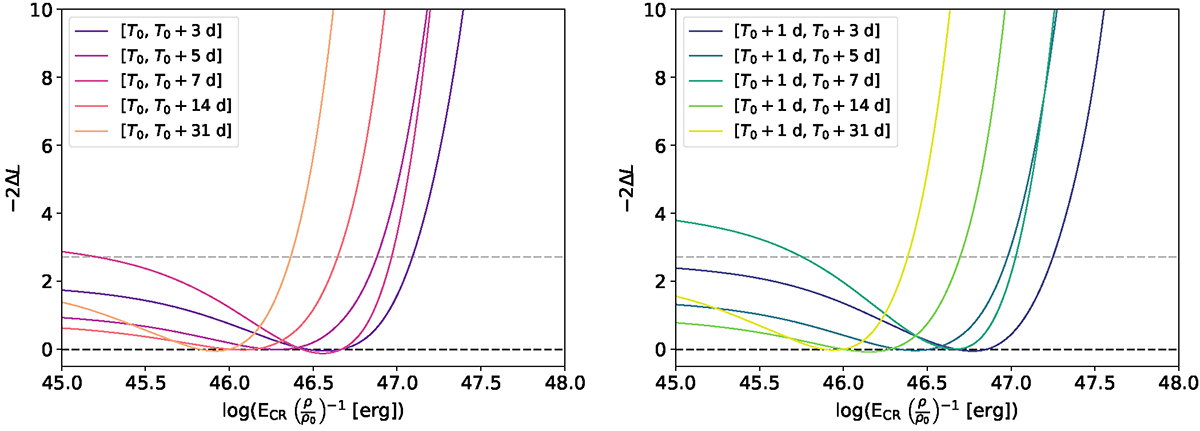
Fig. 7.
Download original image
Likelihood profiles assuming a flat ρ0 density profile for different exposure times ΔT, starting at either T0 (left) or T0 + 1 d (right). ΔL is defined as the difference between the likelihood and that corresponding to the ECR value which maximises it unconditionally (black dashed line). In all panels, the grey dashed line represents the 95% limit, and the obtained likelihoods are interpolated employing a cubic spline.
Current usage metrics show cumulative count of Article Views (full-text article views including HTML views, PDF and ePub downloads, according to the available data) and Abstracts Views on Vision4Press platform.
Data correspond to usage on the plateform after 2015. The current usage metrics is available 48-96 hours after online publication and is updated daily on week days.
Initial download of the metrics may take a while.