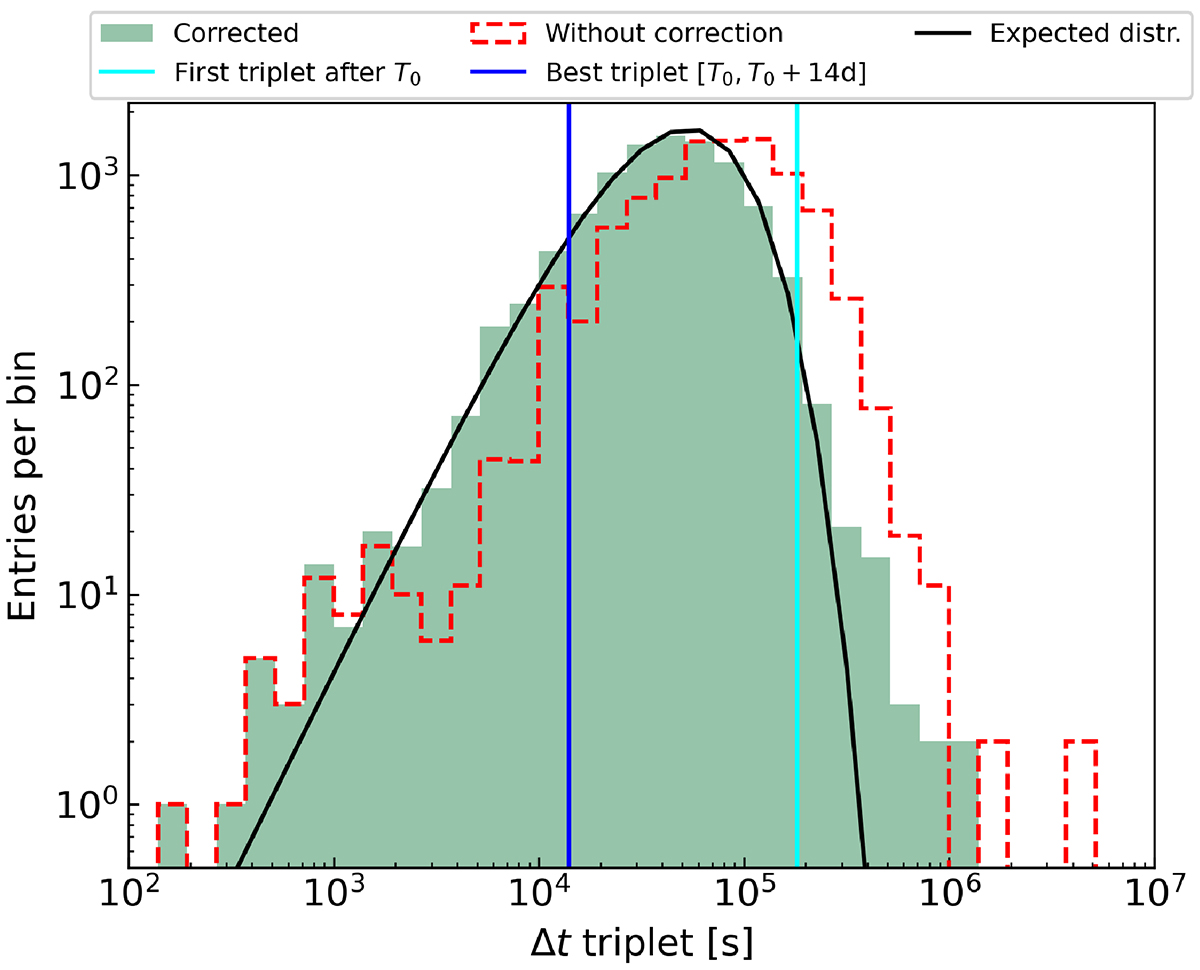
Fig. 3.
Download original image
Triplet distribution. This is the distribution of the time intervals Δt of the photon triplets with (filled green) and without (red line) considering the correction of the bad intervals due to the LAT orbit and field of view. The expected distribution for independent events is shown as a black line. The vertical lines represent the first photon triplet after T0 (in cyan) and the shortest duration triplet in the two weeks after T0 (in blue), respectively. The latter is obtained from an analysis of a two-week interval after T0 in order to account for the uncertainty on the estimated T0, as well as for a possible delay in the γ-ray emission from the SN. A significant triplet would appear in the left tail of the distribution. This is not the case for either of the highlighted triplets.
Current usage metrics show cumulative count of Article Views (full-text article views including HTML views, PDF and ePub downloads, according to the available data) and Abstracts Views on Vision4Press platform.
Data correspond to usage on the plateform after 2015. The current usage metrics is available 48-96 hours after online publication and is updated daily on week days.
Initial download of the metrics may take a while.