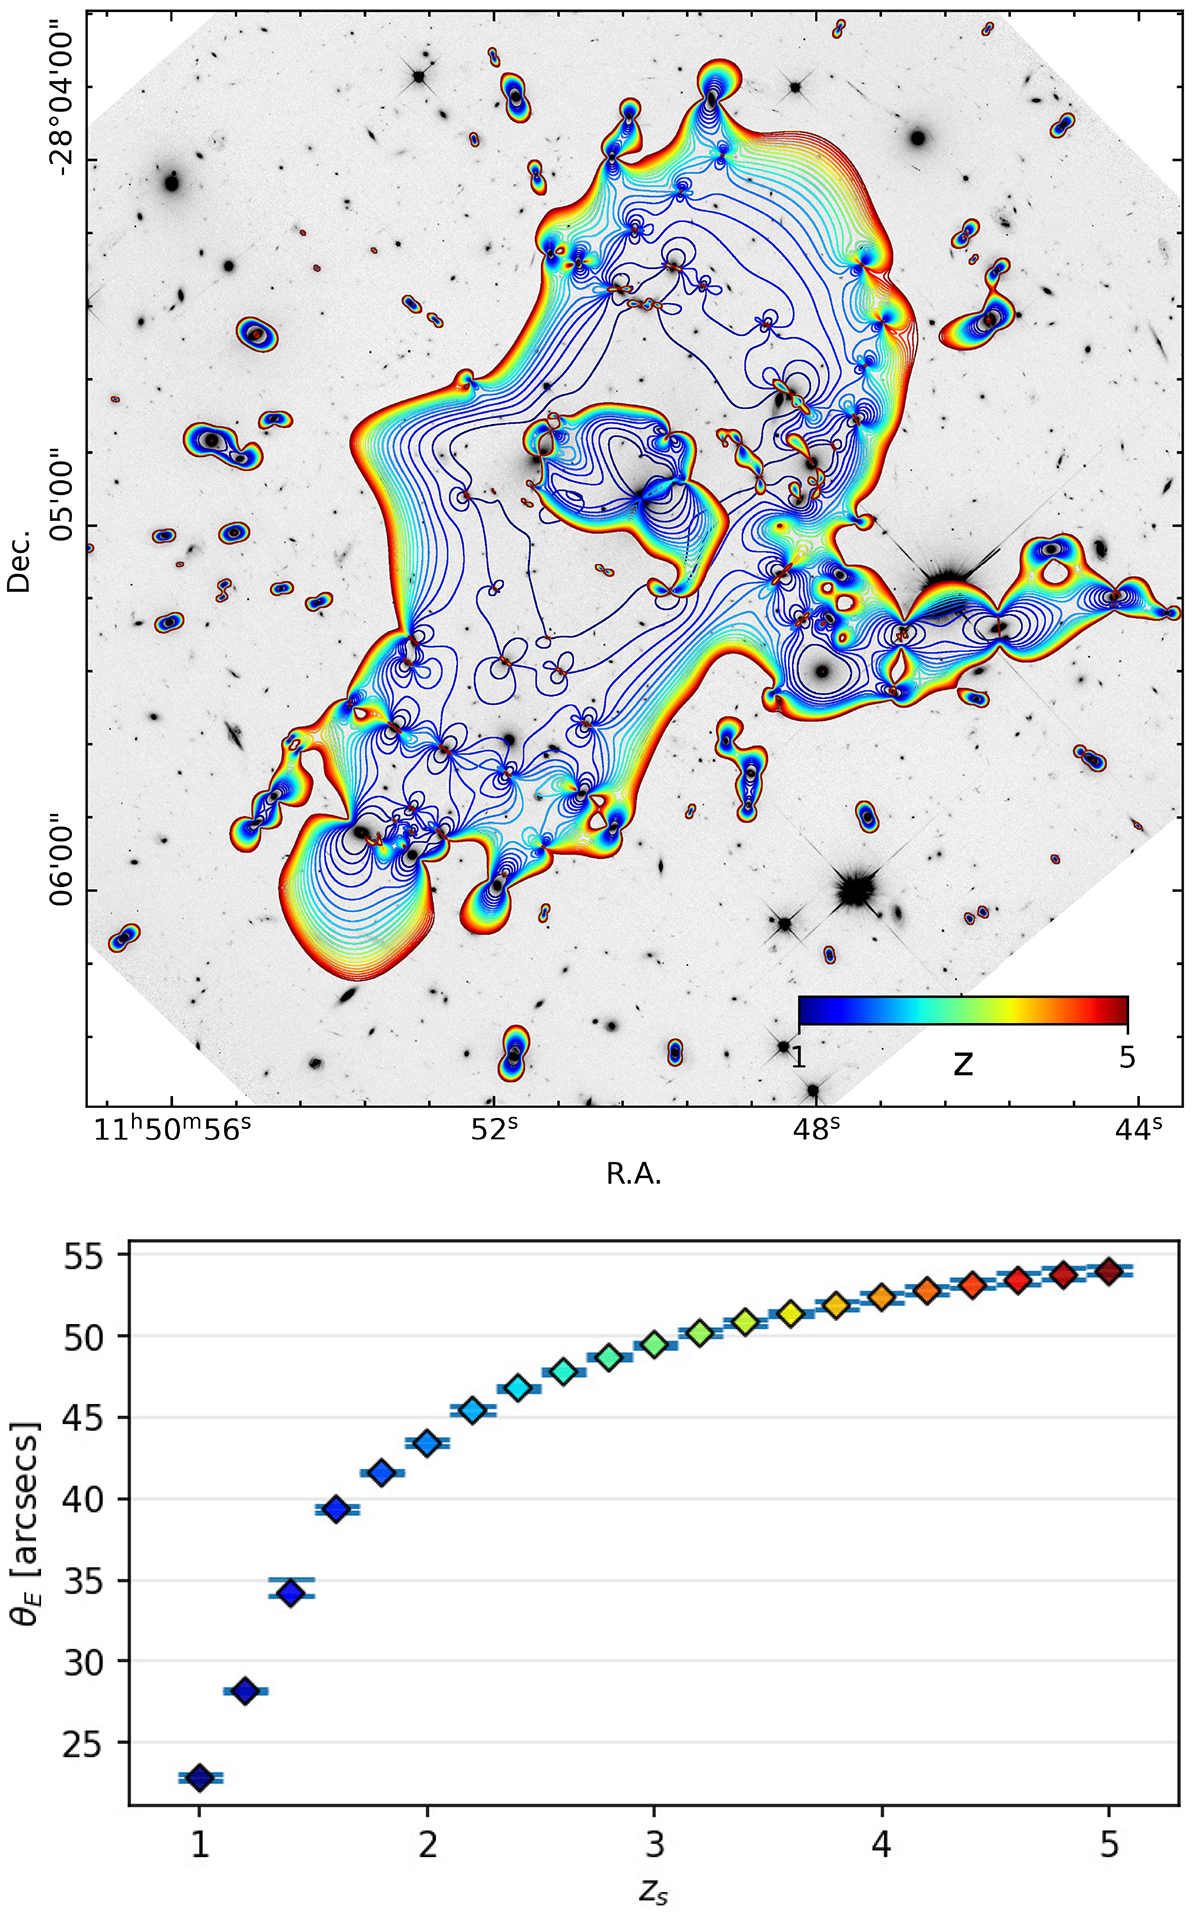
Fig. 7.
Download original image
Critical curves, overlaid onto the F814W image, for various redshift values, zs, of the source plane in the range 1 ≤ zs ≤ 5 (upper panel) and the corresponding effective Einstein radii, θE, (lower panel). Error bars in the Einstein radii plot indicate the 16th and 84th percentiles. The values are reported in Table 5. The color maps the redshift of the source, zs.
Current usage metrics show cumulative count of Article Views (full-text article views including HTML views, PDF and ePub downloads, according to the available data) and Abstracts Views on Vision4Press platform.
Data correspond to usage on the plateform after 2015. The current usage metrics is available 48-96 hours after online publication and is updated daily on week days.
Initial download of the metrics may take a while.