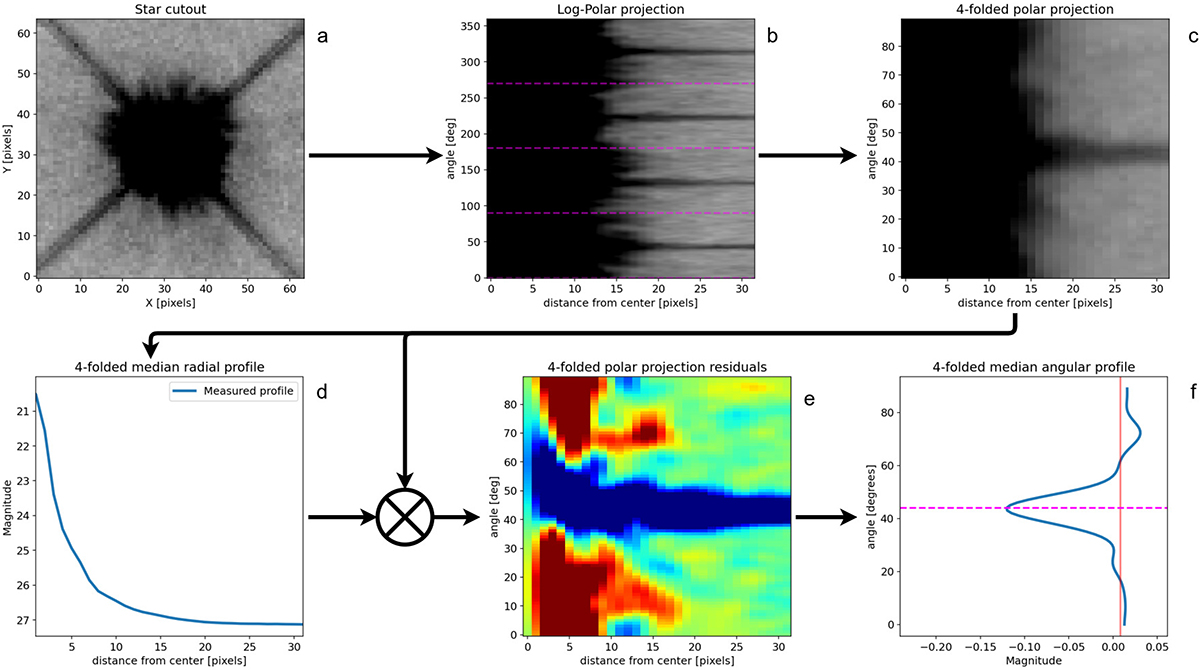
Fig. A.2.
Download original image
Flowchart of the spike detection algorithm: a) original cutout of the star; b) log-Polar transformed cutout. The dashed magenta lines indicate the division into four stripes of same size; c) median stacking of the stripes; d) radial profile of the median stripe; e) residual image obtained by first subtracting the radial profile from the median stripe and then dividing the result by the same radial profile; f) angular profile of the residual image, obtained by computing the median value along the radial axis. The magenta dashed line indicates the angular position of the spike.
Current usage metrics show cumulative count of Article Views (full-text article views including HTML views, PDF and ePub downloads, according to the available data) and Abstracts Views on Vision4Press platform.
Data correspond to usage on the plateform after 2015. The current usage metrics is available 48-96 hours after online publication and is updated daily on week days.
Initial download of the metrics may take a while.