Fig. A.1.
Download original image
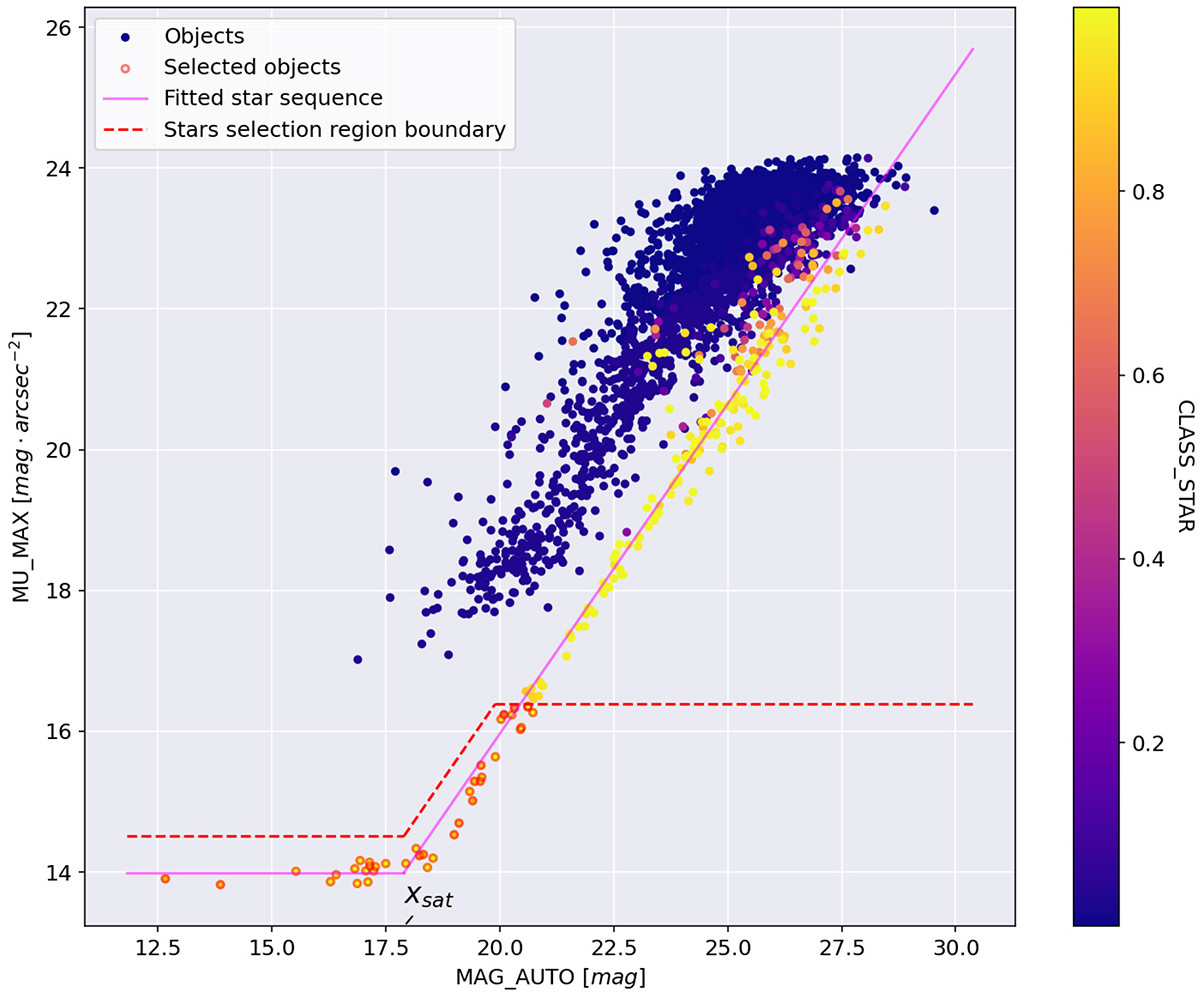
Objects distribution in the plane MU_MAX vs. MAG_AUTO for the F814W band. Color maps to Sextractor stellarity index CLASS_STAR, where yellow indicates a star and blue indicates not a star. The magenta solid line is the fitted model of the star sequence, while the red dashed line indicates the thresholds used to select the brightest stars that may contain diffraction spikes. Objects circled in red are the actually selected stars.
Current usage metrics show cumulative count of Article Views (full-text article views including HTML views, PDF and ePub downloads, according to the available data) and Abstracts Views on Vision4Press platform.
Data correspond to usage on the plateform after 2015. The current usage metrics is available 48-96 hours after online publication and is updated daily on week days.
Initial download of the metrics may take a while.