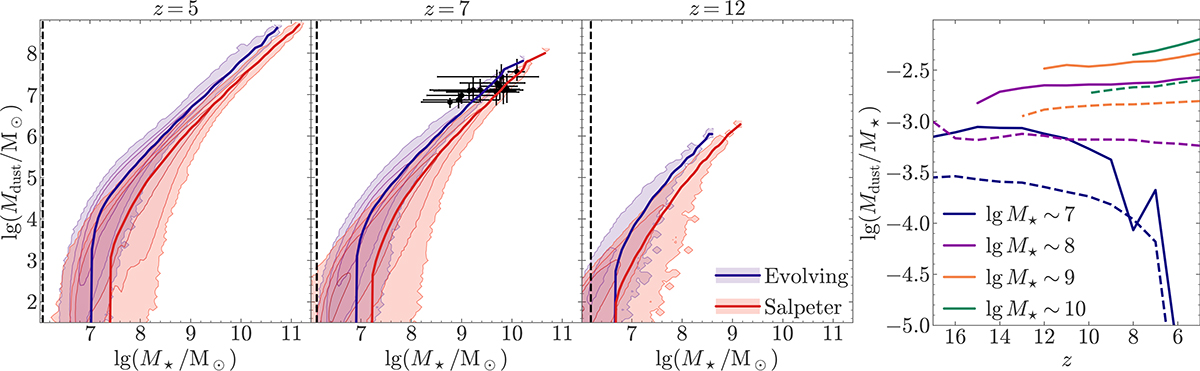
Fig. 9.
Download original image
Redshift evolution of the dust to stellar mass relation. Left: relation between the dust and stellar mass for the Salpeter IMF (red) and evolving IMF (blue). Coloured thick solid lines depict the medians of the distributions of dust masses (coloured contours) at a given stellar mass. Black circles show the observational results at z ≃ 7 from the REBELS survey shown in Dayal et al. (2022) assuming a Salpeter IMF. Vertical black dashed lines denote the stellar mass threshold in and Salpeter IMF simulations, below which the stellar masses have not converged for all galaxies due to the mass resolution limit of the VSMDPL simulation. Right: redshift evolution of the dust-to-stellar mass ratio for different stellar mass bins with a width of 1 dex. The values in the panel shows the central value of each stellar mass bin. Circles show median values of the REBELS galaxies.
Current usage metrics show cumulative count of Article Views (full-text article views including HTML views, PDF and ePub downloads, according to the available data) and Abstracts Views on Vision4Press platform.
Data correspond to usage on the plateform after 2015. The current usage metrics is available 48-96 hours after online publication and is updated daily on week days.
Initial download of the metrics may take a while.