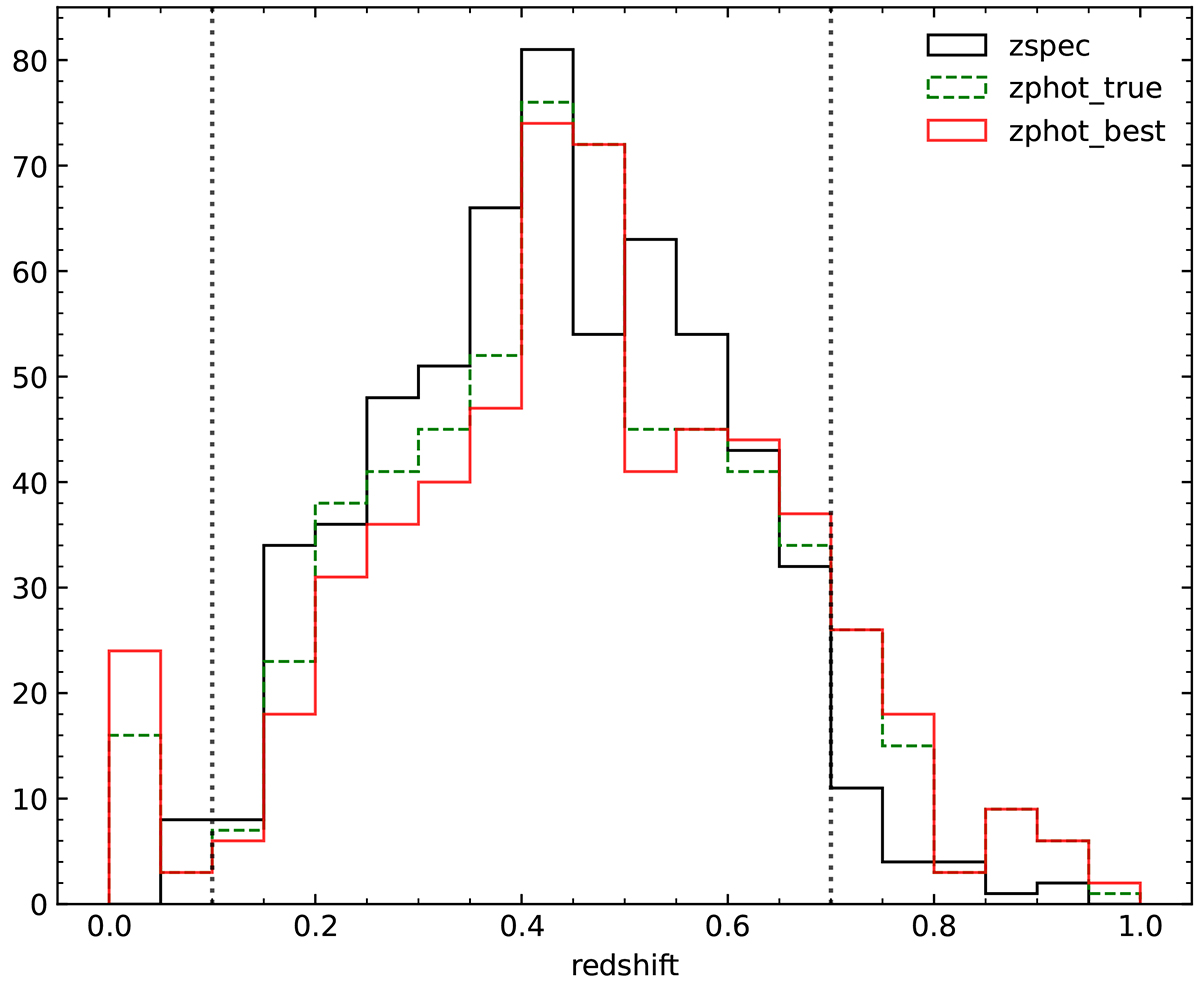
Fig. 7.
Download original image
Distribution of redshift for the SN Ia host candidates. The black one uses the true simulated redshift (zspec), the green dashed line represents the photometric redshift of the true host galaxy (zphot_true), while the red continuous distribution refers to the photometric redshift of the associated host galaxy (zphot_best). The two vertical lines define the range where we evaluate the volumetric rate and the plot is cut to z = 1.0 for visual clarity.
Current usage metrics show cumulative count of Article Views (full-text article views including HTML views, PDF and ePub downloads, according to the available data) and Abstracts Views on Vision4Press platform.
Data correspond to usage on the plateform after 2015. The current usage metrics is available 48-96 hours after online publication and is updated daily on week days.
Initial download of the metrics may take a while.