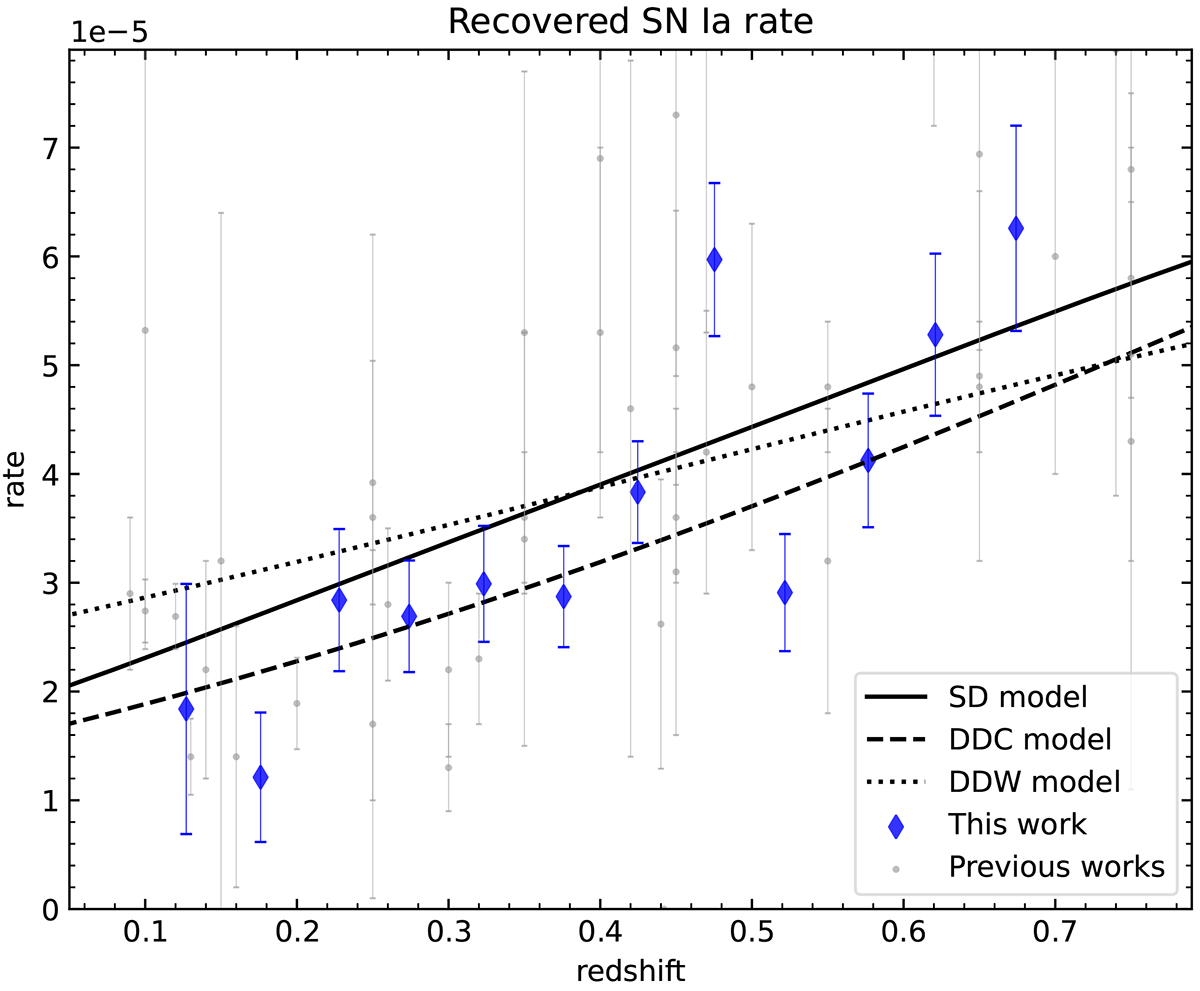
Fig. 12.
Download original image
Recovered SN Ia rate for the sample_psnid_zphot_best (the real observing case) with rate predictions of progenitor models from Greggio (2005). Error bars on the blue point are due to statistical uncertainties scaled to 10 yr over the simulated ∼15 deg2 (although we expect higher statistics with the real survey, with statistical errors reduced by more than one order of magnitude). The gray points represent rate measurement from the literature, as shown in Fig. 1.
Current usage metrics show cumulative count of Article Views (full-text article views including HTML views, PDF and ePub downloads, according to the available data) and Abstracts Views on Vision4Press platform.
Data correspond to usage on the plateform after 2015. The current usage metrics is available 48-96 hours after online publication and is updated daily on week days.
Initial download of the metrics may take a while.