Fig. 6
Download original image
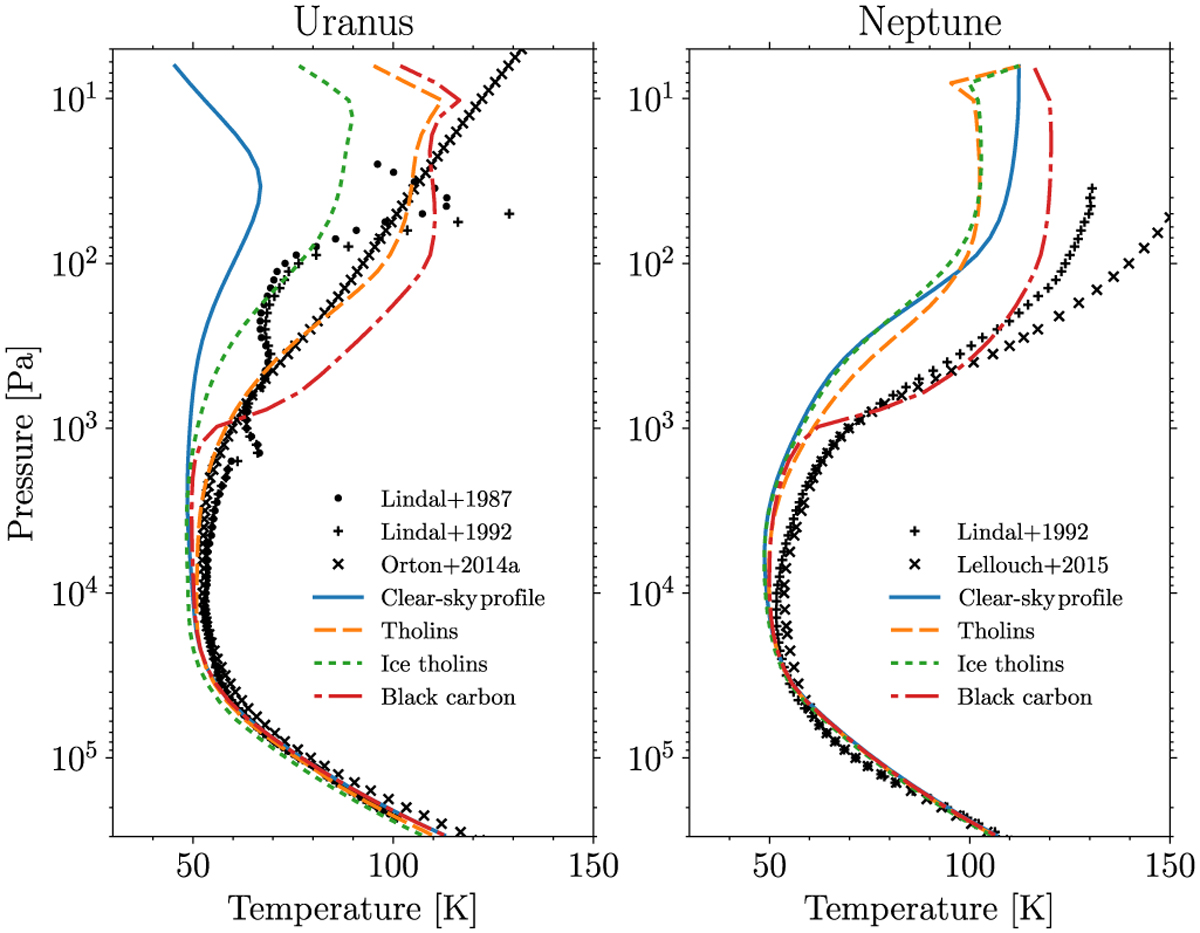
Simulated temperature profiles of Uranus (left) and Neptune (right) with the Irwin et al. (2022) haze scenario but with different optical indices. The dashed orange line is the case where the Irwin et al. (2022) optical indices were replaced by those of tholins (Khare et al. 1984) and the dotted green line corresponds to ice tholins (Khare et al. 1993). The dotted-dashed red line is the temperature simulated with an ad hoc black carbon dust layer located between 5 and 1000 Pa. In comparison, the temperature reached without aerosols is displayed as a blue line and the different observations are shown in black as described in Fig. 1.
Current usage metrics show cumulative count of Article Views (full-text article views including HTML views, PDF and ePub downloads, according to the available data) and Abstracts Views on Vision4Press platform.
Data correspond to usage on the plateform after 2015. The current usage metrics is available 48-96 hours after online publication and is updated daily on week days.
Initial download of the metrics may take a while.