Fig. 5
Download original image
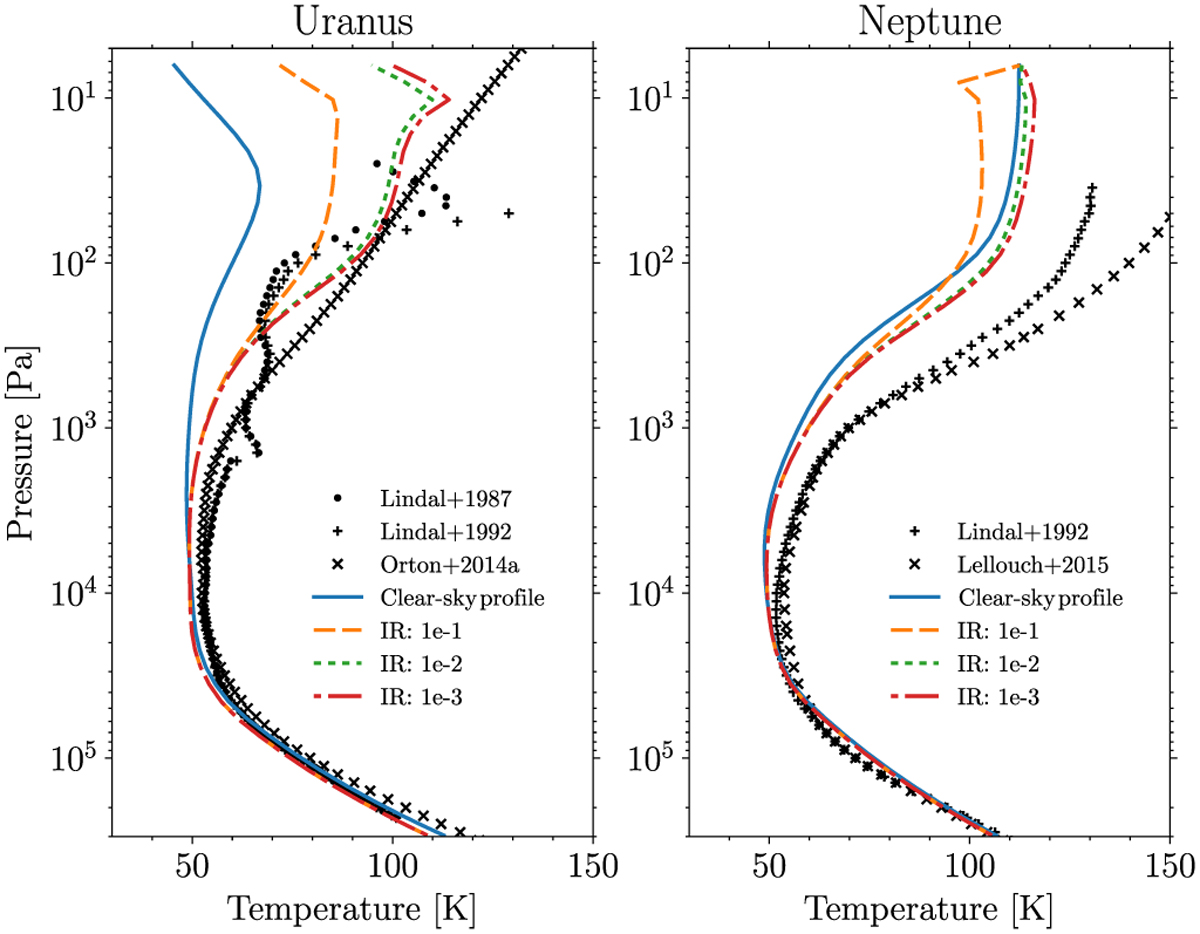
Simulated temperature profiles of Uranus (left) and Neptune (right) with the Irwin et al. (2022) haze scenario for three different values of the absorption coefficient in the thermal infrared. The dashed orange line is the case with an imaginary index of 10−1 in the thermal infrared, the dotted green line is the 10−2 case, and the dotted-dashed red line is the 10−3 case. For ni lower than 10−3 in the thermal infrared, we obtain the same temperature profile as the case at 10−3. In comparison, the temperature reached without aerosols was added as a blue line and the different observations are shown in black as described in Fig. 1.
Current usage metrics show cumulative count of Article Views (full-text article views including HTML views, PDF and ePub downloads, according to the available data) and Abstracts Views on Vision4Press platform.
Data correspond to usage on the plateform after 2015. The current usage metrics is available 48-96 hours after online publication and is updated daily on week days.
Initial download of the metrics may take a while.