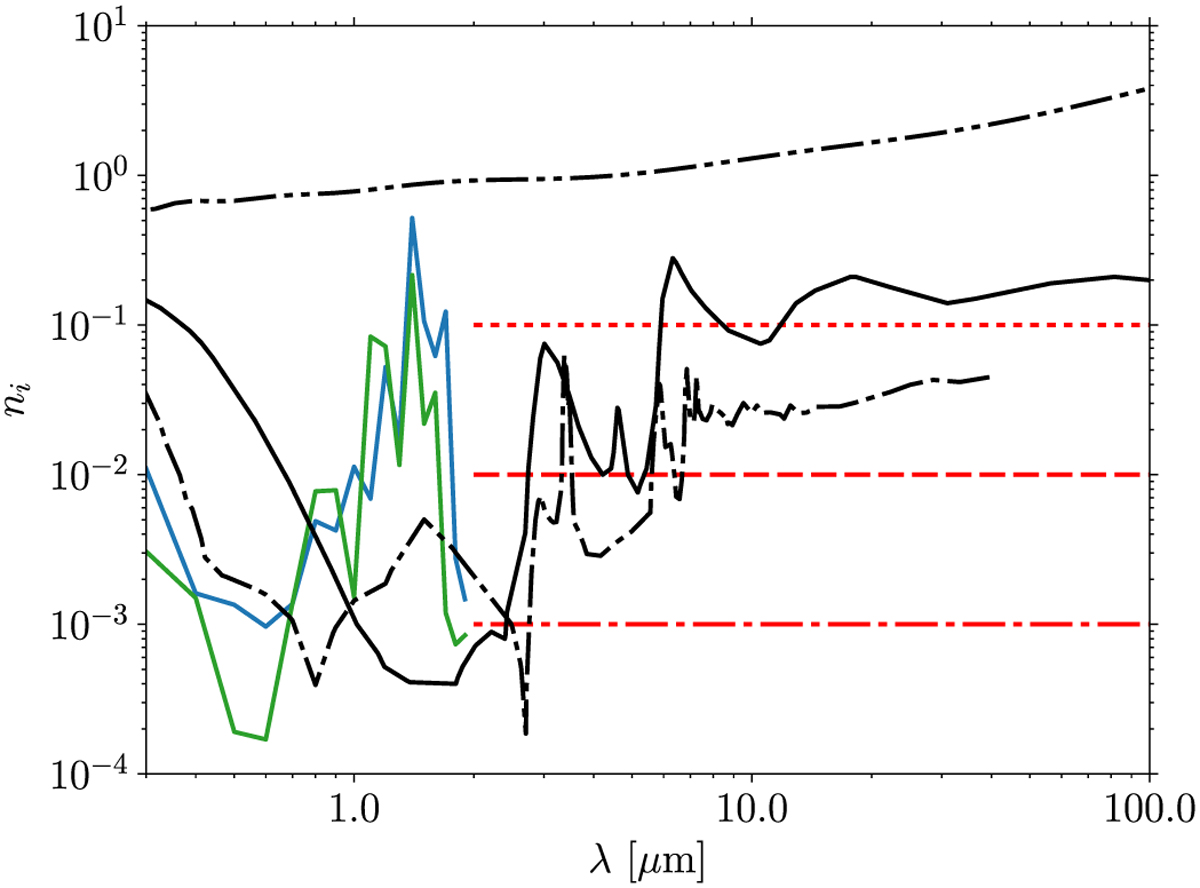
Fig. 3
Download original image
Uranus: imaginary refractive indices for Uranus. The blue line corresponds to the vertically extended photochemical haze and the green line to the concentrated haze located near the CH4 condensation level from Irwin et al. (2022). Three different ad hoc values (1 × 10⁻¹, 1 × 10⁻², 1 × 10⁻³) in the thermal infrared (>2 µm) are added (red lines). For reference, refractive indices of tholins (Khare et al. 1984), ice tholins (Khare et al. 1993) and black carbon (Jäger et al. 1998) are also shown in solid, dotted-dashed and double dotted-dashed black lines respectively.
Current usage metrics show cumulative count of Article Views (full-text article views including HTML views, PDF and ePub downloads, according to the available data) and Abstracts Views on Vision4Press platform.
Data correspond to usage on the plateform after 2015. The current usage metrics is available 48-96 hours after online publication and is updated daily on week days.
Initial download of the metrics may take a while.