Fig. 20
Download original image
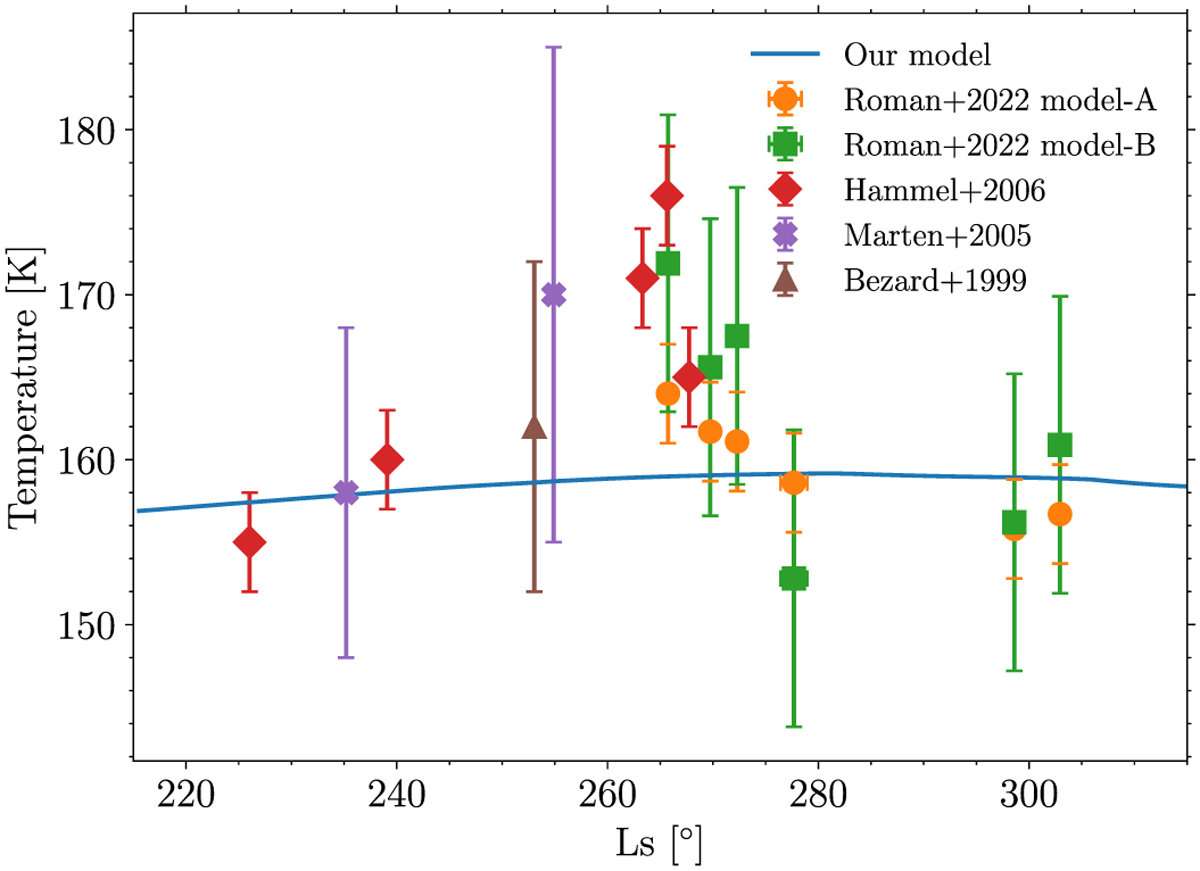
Comparison of the simulated disk-averaged temperature at 10 Pa on Neptune computed given the subsolar latitude observed from Earth (blue line) and the disk-averaged temperatures retrieved by Bézard et al. (1999) at ~5 Pa (brown triangle), Marten et al. (2005) at ~10 Pa (violet cross), Hammel et al. (2006) between ~10 and 1 Pa (red diamond), and Roman et al. (2022) at ~10 Pa (green square and orange circle). Due to the global offset in temperature between our simulations and the observations (Fig. 13), we have added +35K to our model results to help compare the trends in the datasets.
Current usage metrics show cumulative count of Article Views (full-text article views including HTML views, PDF and ePub downloads, according to the available data) and Abstracts Views on Vision4Press platform.
Data correspond to usage on the plateform after 2015. The current usage metrics is available 48-96 hours after online publication and is updated daily on week days.
Initial download of the metrics may take a while.