Open Access
Fig. 19
Download original image
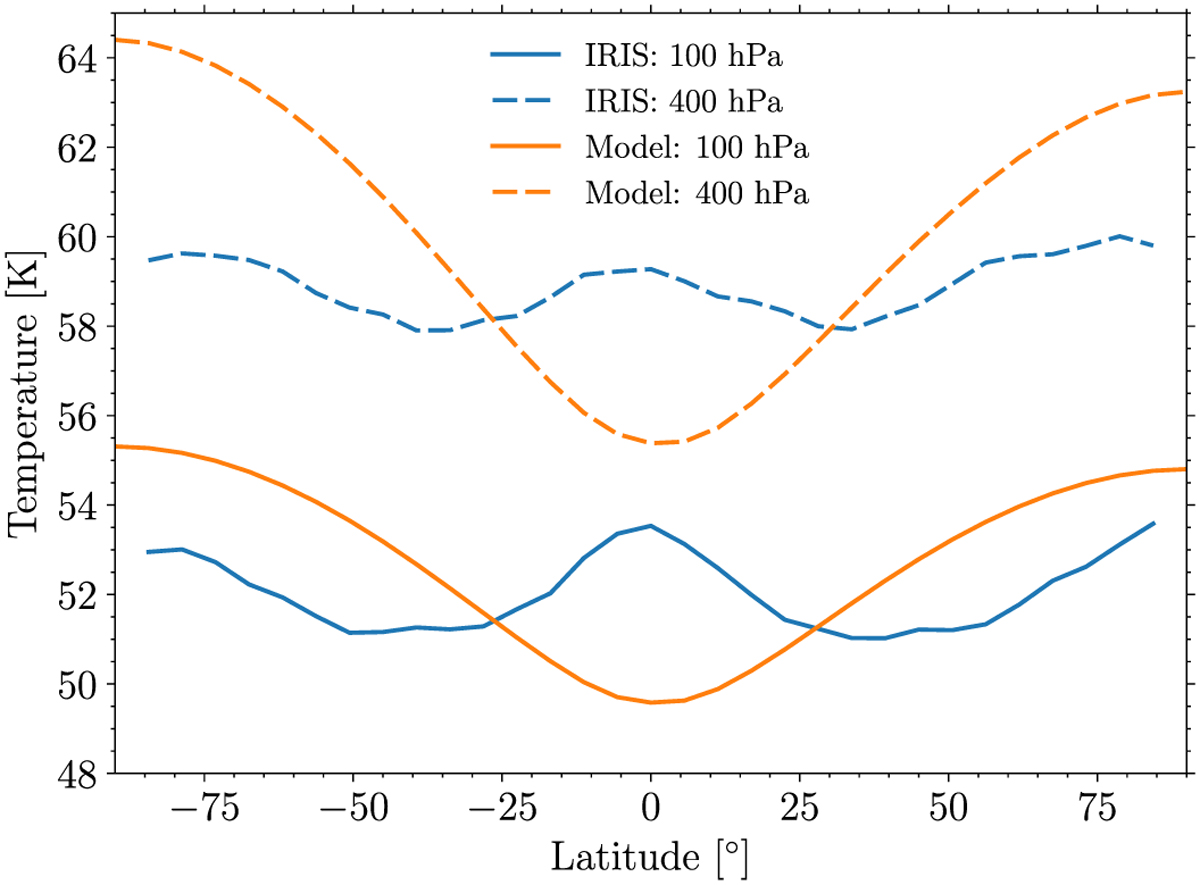
Uranus: comparison of the temperature retrieved (blue line) from the Voyager 2/IRIS experiment (Orton et al. 2015) and the simulated temperature (orange line) at 100 hPa (solid line) and 400 hPa (dashed line). Uncertainties from the spectral inversion of IRIS data are lower than 1 K.
Current usage metrics show cumulative count of Article Views (full-text article views including HTML views, PDF and ePub downloads, according to the available data) and Abstracts Views on Vision4Press platform.
Data correspond to usage on the plateform after 2015. The current usage metrics is available 48-96 hours after online publication and is updated daily on week days.
Initial download of the metrics may take a while.