Open Access
Fig. 18
Download original image
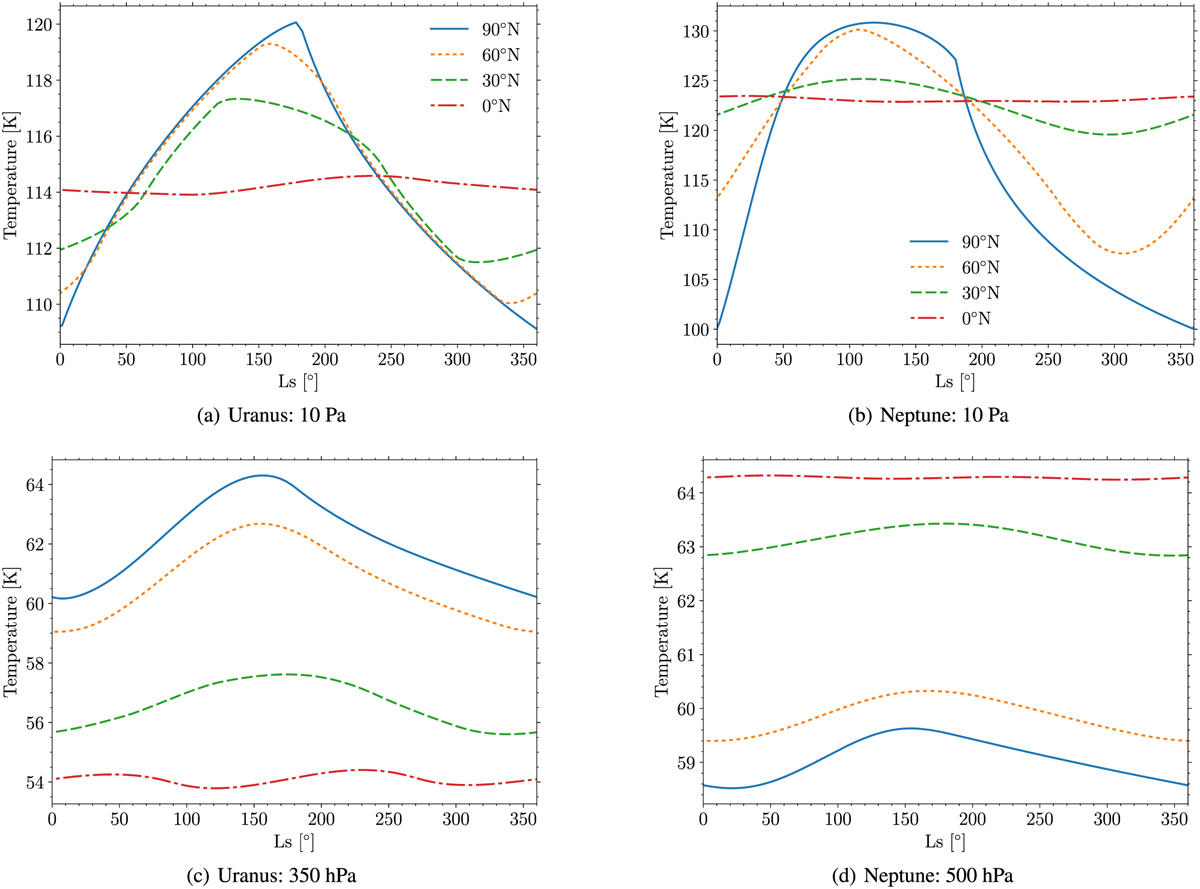
Evolution of the temperature during one planetary year on Uranus (left) at 10 Pa (a) and 350 hPa (c) and on Neptune (right) at 10 Pa (b) and 500 hPa (d) for a latitude of 90°N (solid blue line), 60°N (dotted orange line), 30°N (dashed green line), and 0° (dashed-dotted red line).
Current usage metrics show cumulative count of Article Views (full-text article views including HTML views, PDF and ePub downloads, according to the available data) and Abstracts Views on Vision4Press platform.
Data correspond to usage on the plateform after 2015. The current usage metrics is available 48-96 hours after online publication and is updated daily on week days.
Initial download of the metrics may take a while.