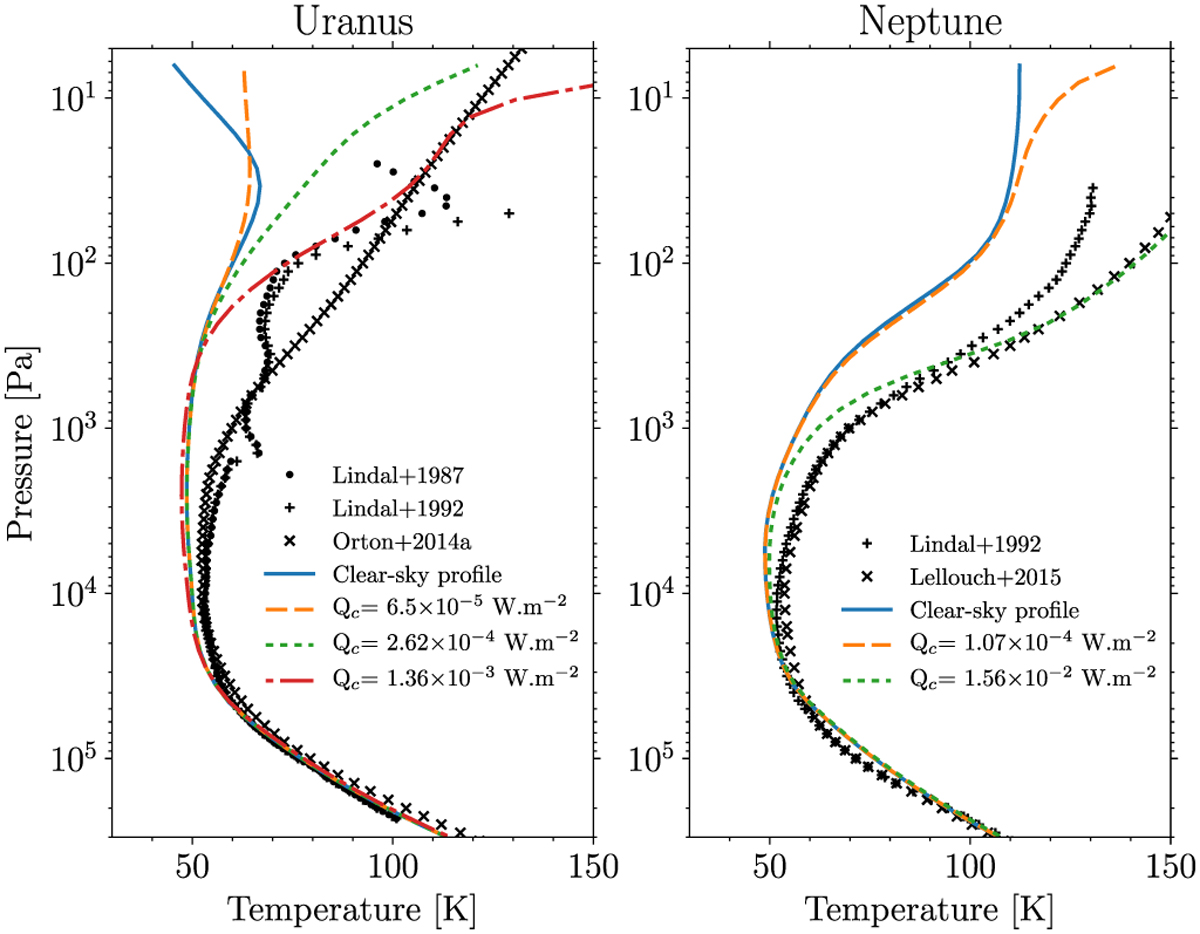
Fig. 12
Download original image
Scenario with no hazes including heat conduction. Left: simulated temperature profiles on Uranus for the UC1 (dashed orange curve), UC2 (dotted green curve) and UC3 (dotted-dashed red curve) thermo-spheric conduction scenarios. Right: simulated temperature profiles on Neptune for NC1 (dashed orange curve) and NC2 (dotted green curve) thermospheric conduction scenario. The solid blue line is the clear-sky model (Sect. 3). The black symbols are the observed temperatures described in Fig. 1.
Current usage metrics show cumulative count of Article Views (full-text article views including HTML views, PDF and ePub downloads, according to the available data) and Abstracts Views on Vision4Press platform.
Data correspond to usage on the plateform after 2015. The current usage metrics is available 48-96 hours after online publication and is updated daily on week days.
Initial download of the metrics may take a while.