Fig. 11
Download original image
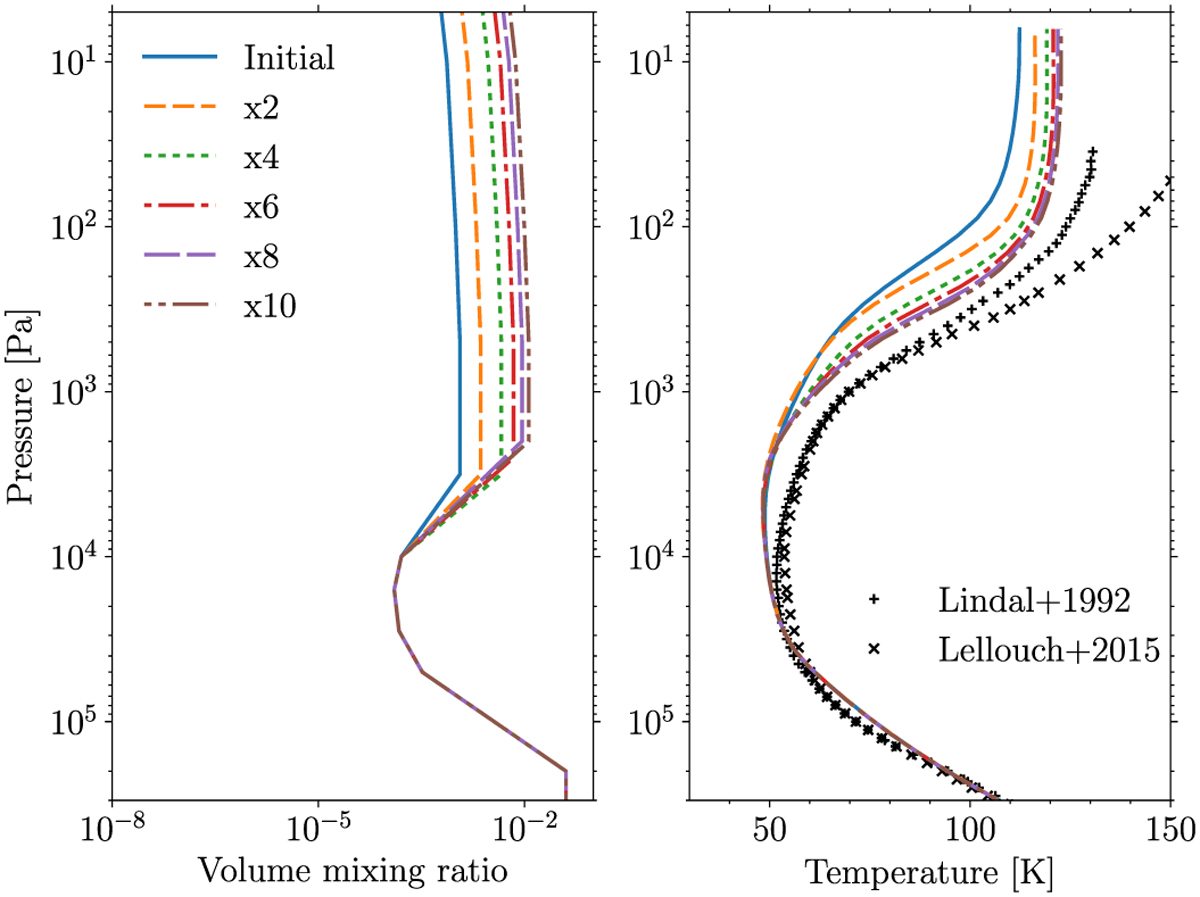
Simulated temperature profiles with different methane abundances on Neptune. Left: CH4 vmr profile on Neptune with the nominal CH4 vmr profile (solid blue line, see Sect. 3), or with that abundance multiplied by two (short dashed orange curve), four (dotted green curve), six (dotted-dashed red curve), eight (long dashed violet curve), and ten (double dotted-dashed maroon curve) above the methane condensation level. Right: the corresponding simulated temperature profiles. The black symbols correspond to the observed temperatures described in Fig. 1.
Current usage metrics show cumulative count of Article Views (full-text article views including HTML views, PDF and ePub downloads, according to the available data) and Abstracts Views on Vision4Press platform.
Data correspond to usage on the plateform after 2015. The current usage metrics is available 48-96 hours after online publication and is updated daily on week days.
Initial download of the metrics may take a while.