Open Access
Fig. 9
Download original image
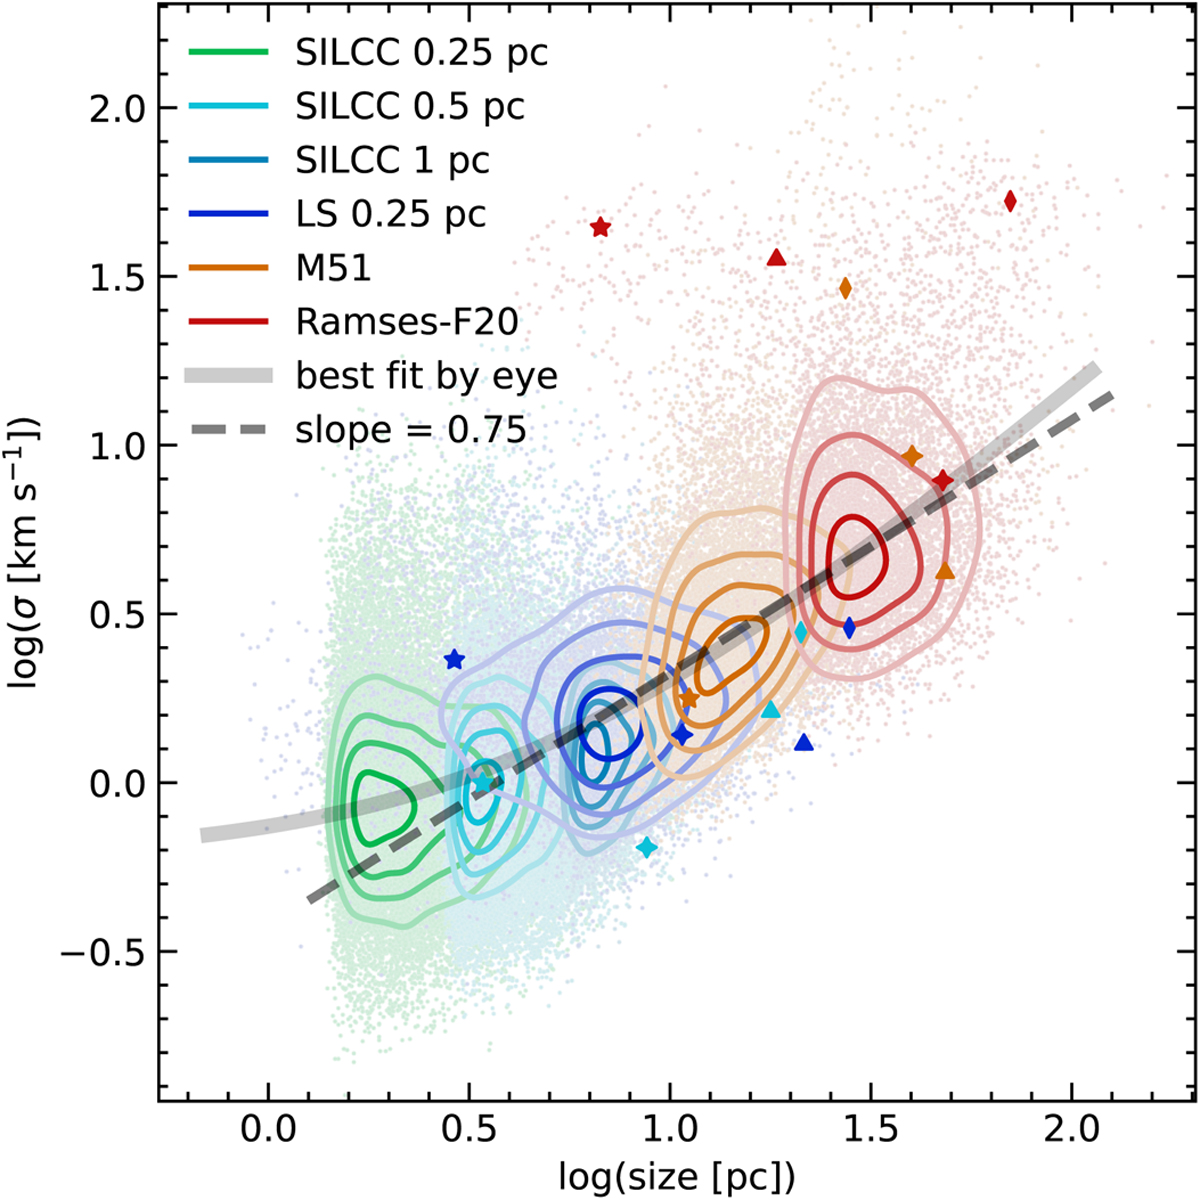
Cloud velocity dispersion as a function of the size. The dashed line illustrates a scaling of σ with size R0.75 while the curved solid line illustrates the trend of the centroids of each distributions. The contour lines and symbols are the same as in Fig. 6.
Current usage metrics show cumulative count of Article Views (full-text article views including HTML views, PDF and ePub downloads, according to the available data) and Abstracts Views on Vision4Press platform.
Data correspond to usage on the plateform after 2015. The current usage metrics is available 48-96 hours after online publication and is updated daily on week days.
Initial download of the metrics may take a while.