Fig. 6
Download original image
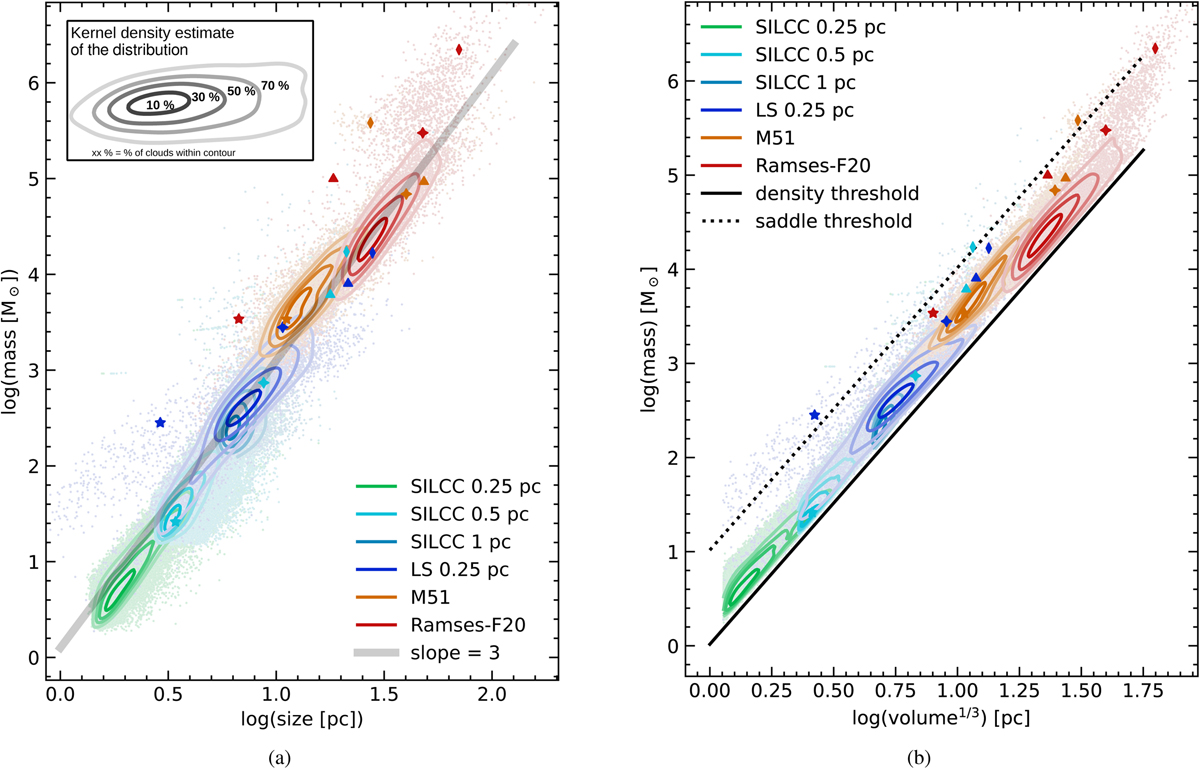
Correlation between cloud size and mass, with the size computed in two different ways. In panel a, the size is defined as the average between the three half-axis of the approximating ellipse, as determined by the structure algorithm. In panel b, the size is computed as the cubic root of the volume. Each dot represents one cloud. The contour lines show a kernel density estimate of the distribution. Starting from the innermost line, approximately 10, 30, 50, and 70% of the distribution lie within the respective contours. The symbols highlight the example clouds from Fig. 2. The grey line in panel a indicates a slope of 3. The solid and dotted line in panel b are iso-density lines for the detection and saddle threshold respectively, as defined in Sec. 2.1 and Appendix A. Their slopes are 3.
Current usage metrics show cumulative count of Article Views (full-text article views including HTML views, PDF and ePub downloads, according to the available data) and Abstracts Views on Vision4Press platform.
Data correspond to usage on the plateform after 2015. The current usage metrics is available 48-96 hours after online publication and is updated daily on week days.
Initial download of the metrics may take a while.