Fig. 4
Download original image
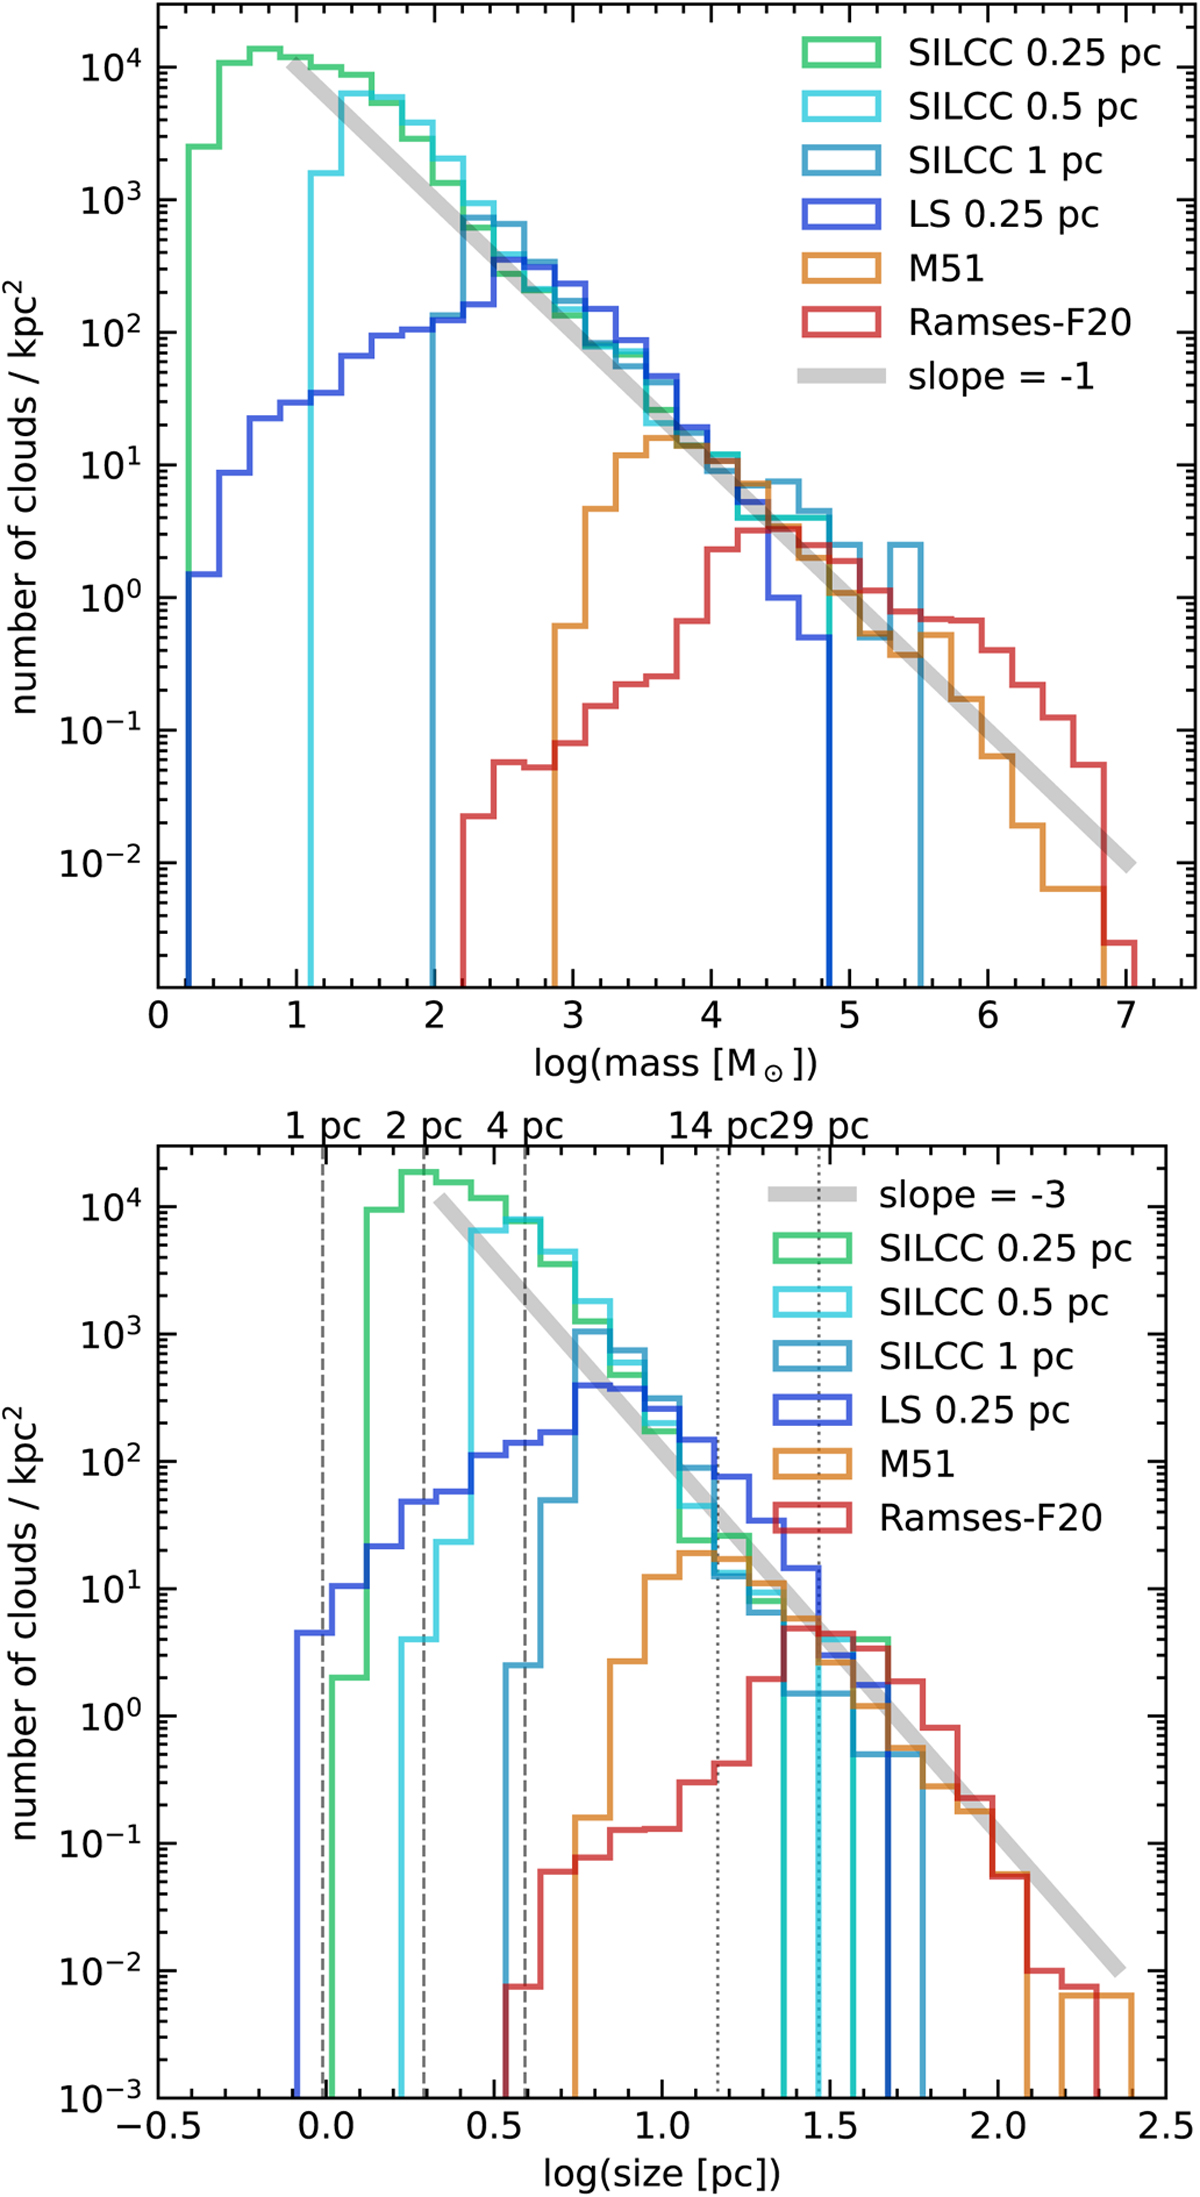
Comparison of the mass (top) and size (bottom) distribution of clouds in the different simulations, normalised according to the relevant surface area of the simulation. To guide the eye, we add a grey line indicating an appropriate power-law slopes of −1 for the mass spectrum in the top panel and −3 for the size distribution in the bottom panel. The dashed lines correspond to multiples of the spacial resolution in the SILCC and LS simulations. The dotted lines show multiples of the resolution for the Ramses galaxy.
Current usage metrics show cumulative count of Article Views (full-text article views including HTML views, PDF and ePub downloads, according to the available data) and Abstracts Views on Vision4Press platform.
Data correspond to usage on the plateform after 2015. The current usage metrics is available 48-96 hours after online publication and is updated daily on week days.
Initial download of the metrics may take a while.