Fig. 2
Download original image
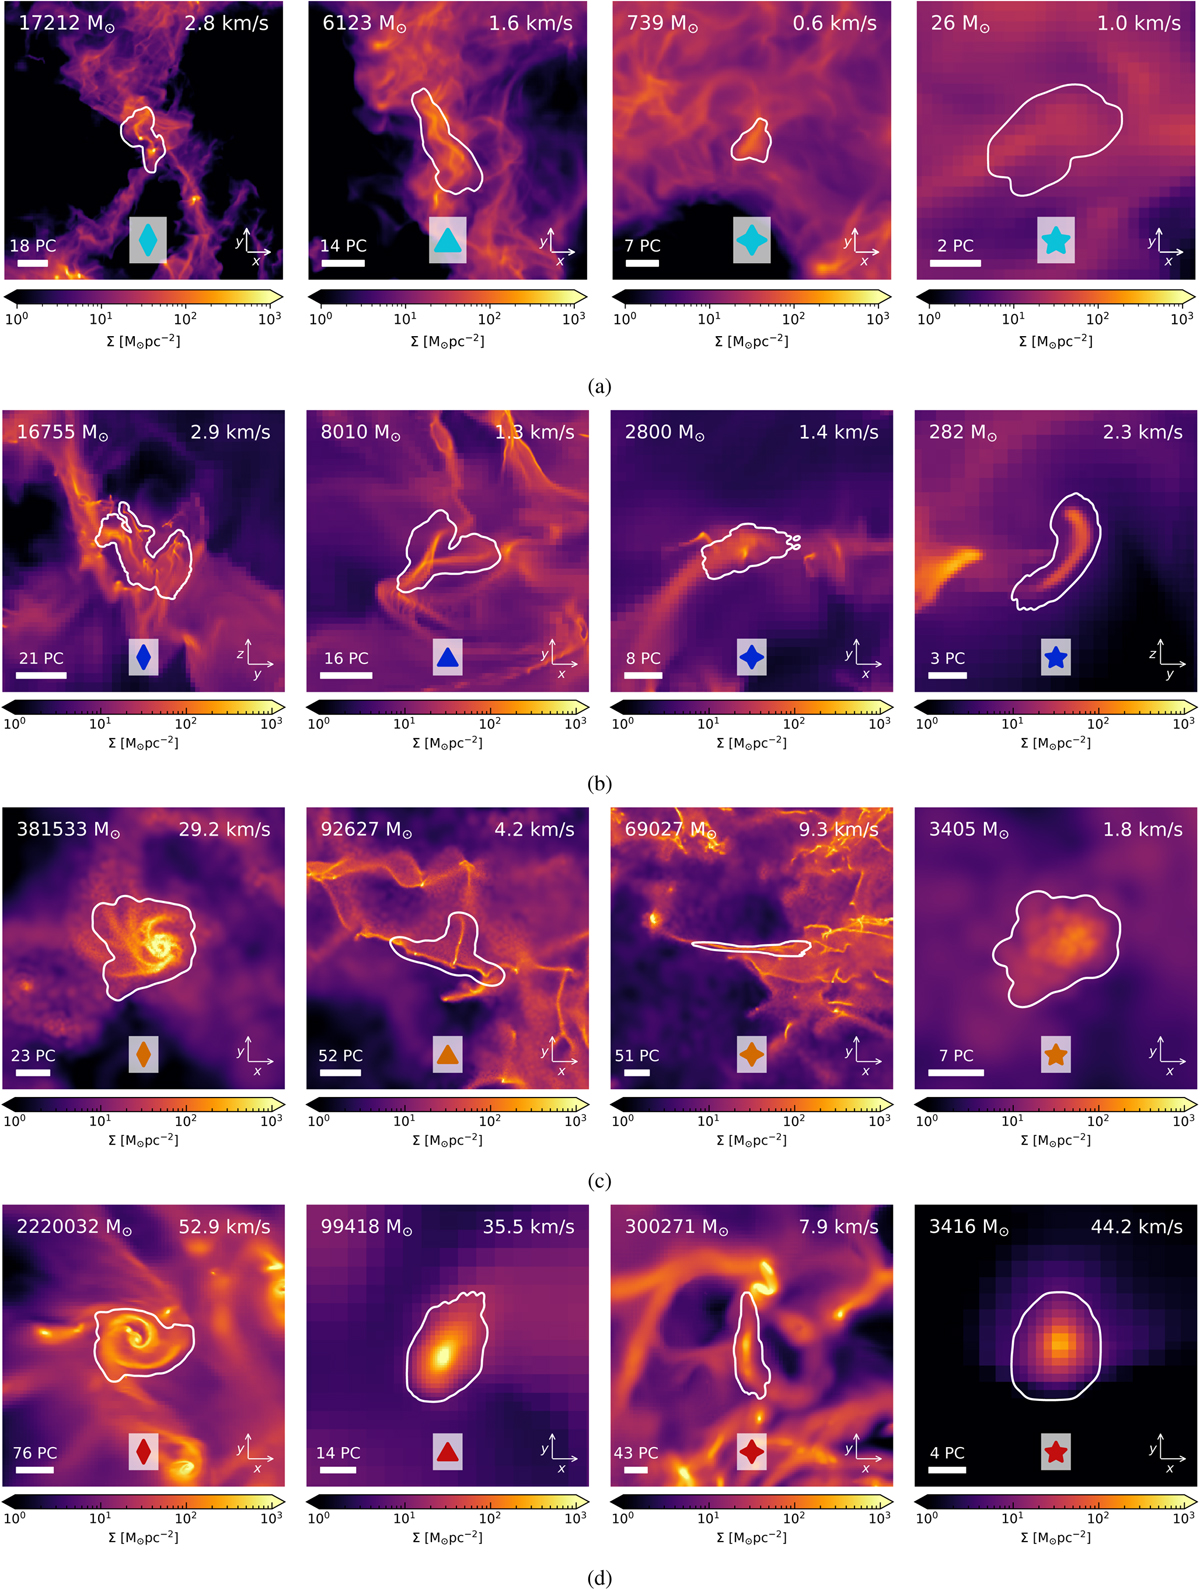
Column density maps of selected clouds extracted from the simulations. The different rows show examples from SILCC-0.5-pc (a), LS-no-driving (b), M51 (c), Ramses-F20 (d). Column density is calculated in a box of three times the maximum extent of the object. Labels are added showing the cloud mass and velocity dispersion. The coloured symbol is used to refer to the cloud in the following figures in the paper.
Current usage metrics show cumulative count of Article Views (full-text article views including HTML views, PDF and ePub downloads, according to the available data) and Abstracts Views on Vision4Press platform.
Data correspond to usage on the plateform after 2015. The current usage metrics is available 48-96 hours after online publication and is updated daily on week days.
Initial download of the metrics may take a while.