Fig. A.1
Download original image
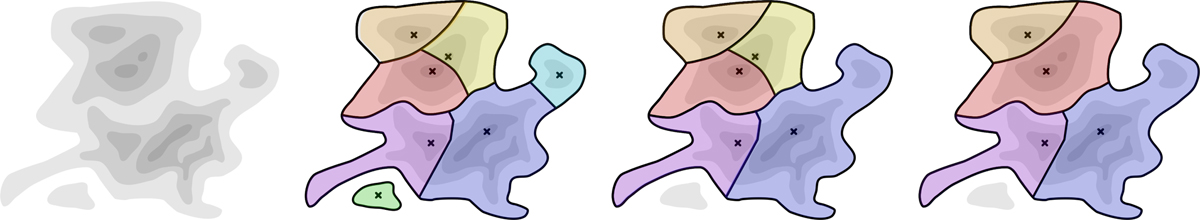
Illustration of structure identification and merging by HOP on a hypothetical density field. First a collection of peak patches around local maxima is identified. Then, the green structure is rejected because its peak density is not high enough. The cyan structure is merged into the blue one for the same reason. Next, the yellow structure is merged into the red one because the saddle density between the structures is larger than the saddle threshold, indicating that they are connected structures.
Current usage metrics show cumulative count of Article Views (full-text article views including HTML views, PDF and ePub downloads, according to the available data) and Abstracts Views on Vision4Press platform.
Data correspond to usage on the plateform after 2015. The current usage metrics is available 48-96 hours after online publication and is updated daily on week days.
Initial download of the metrics may take a while.