Fig. 12
Download original image
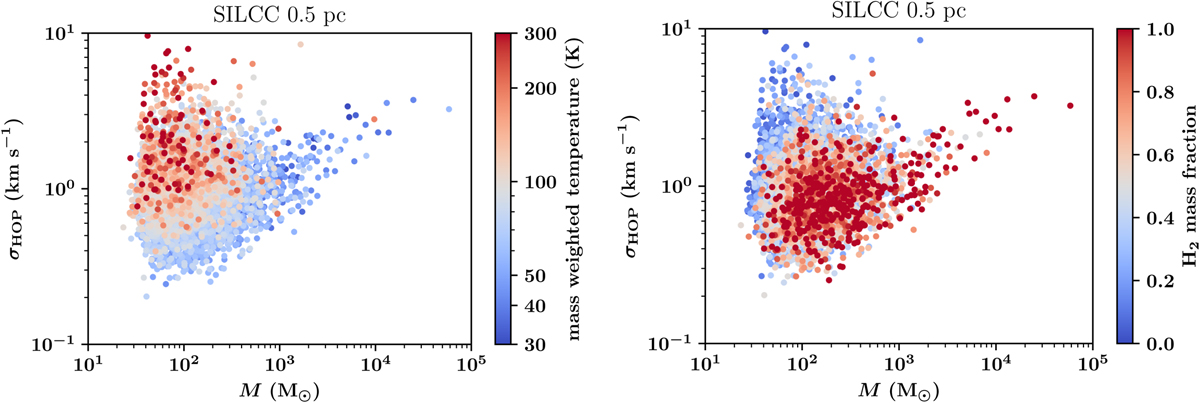
Scatter plot of the velocity distribution as a function of cloud mass for simulation SILCC-0.5pc. Left: colours indicate the mass-weighted temperature in a sphere around the centre of the HOP cloud with a radius corresponding to twice the average size of the HOP cloud. Right: colours indicate the molecular fraction in the surrounding sphere.
Current usage metrics show cumulative count of Article Views (full-text article views including HTML views, PDF and ePub downloads, according to the available data) and Abstracts Views on Vision4Press platform.
Data correspond to usage on the plateform after 2015. The current usage metrics is available 48-96 hours after online publication and is updated daily on week days.
Initial download of the metrics may take a while.