Fig. 11
Download original image
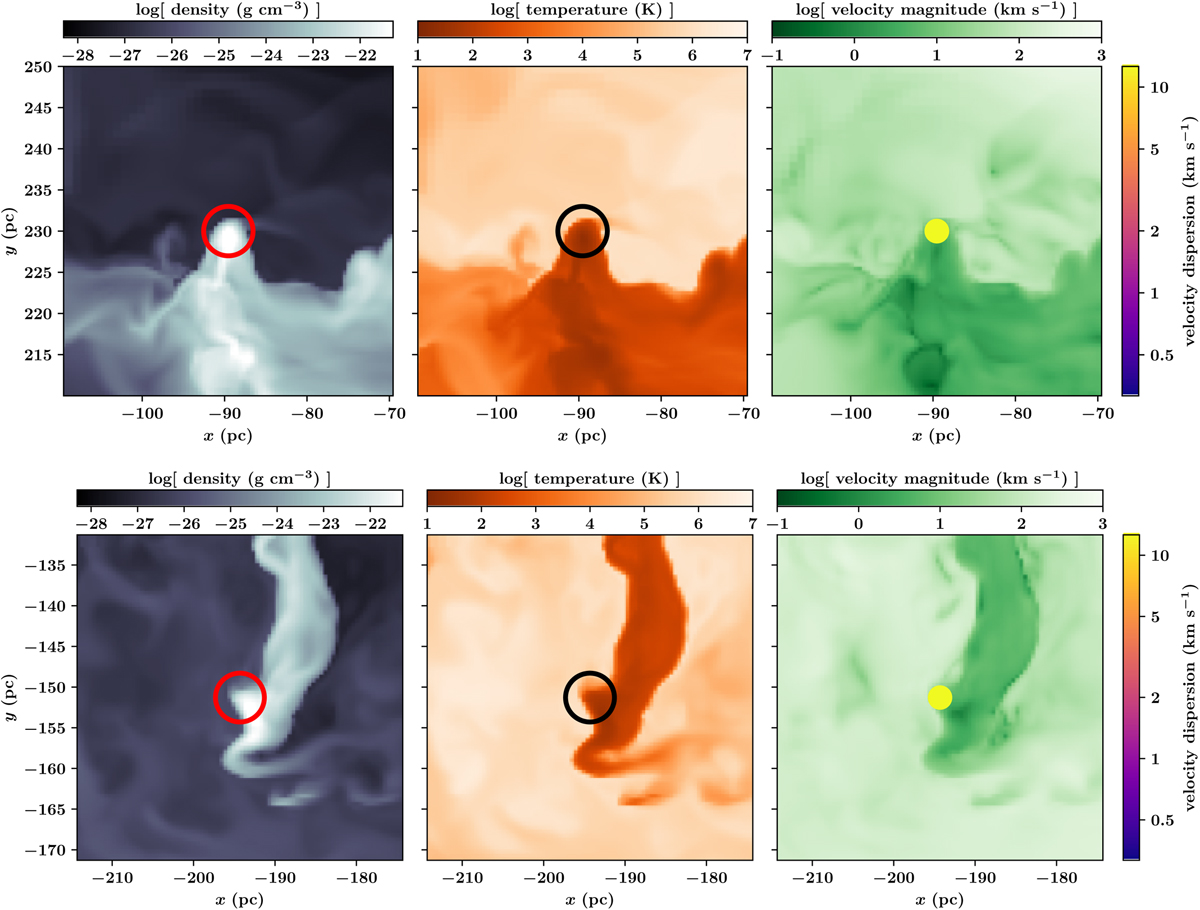
Two examples showing the positions of the clouds with their respective density (left), temperature (middle), and velocity environment (right). In both cases the clouds are located at the edge between cold gas and a hot SN-driven bubble. The resulting high velocity dispersion is thus due to SN-driven turbulence that mixes hot gas into the clouds rather than by gravitational collapse.
Current usage metrics show cumulative count of Article Views (full-text article views including HTML views, PDF and ePub downloads, according to the available data) and Abstracts Views on Vision4Press platform.
Data correspond to usage on the plateform after 2015. The current usage metrics is available 48-96 hours after online publication and is updated daily on week days.
Initial download of the metrics may take a while.