Fig. 10
Download original image
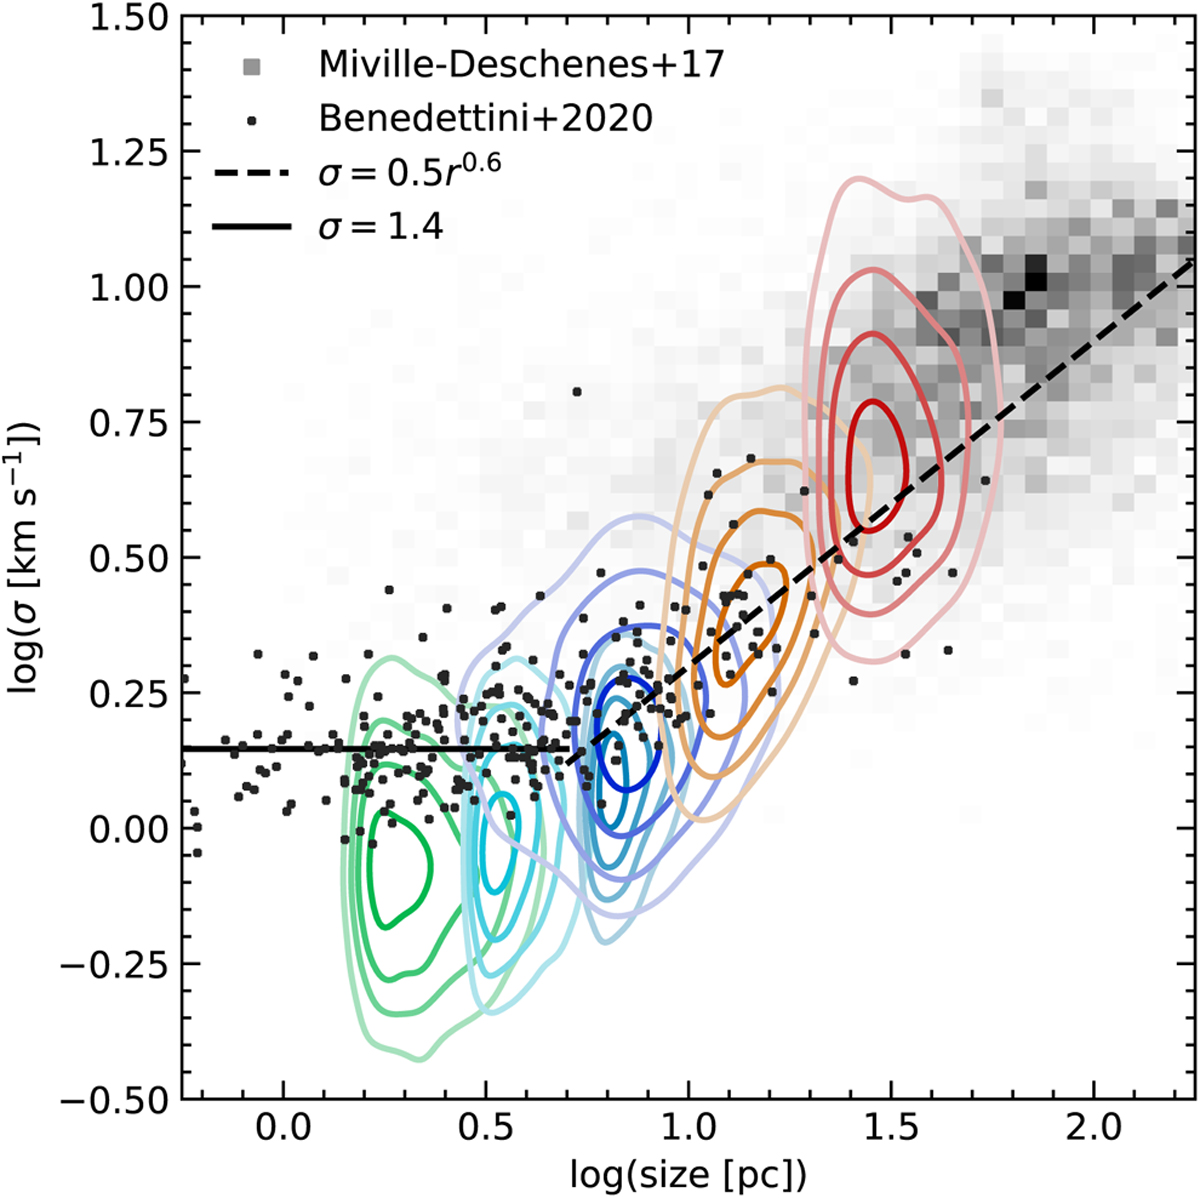
Comparison of the 3D size-velocity dispersion relation found in the simulation with several cloud catalogues from observations. Coloured contours are as in Fig. 6. Observational data feature only the 1D line-of-sight velocity dispersion, which was here multiplied by ![]() for comparison with the 3D velocity dispersion computed in the simulation.
for comparison with the 3D velocity dispersion computed in the simulation.
Current usage metrics show cumulative count of Article Views (full-text article views including HTML views, PDF and ePub downloads, according to the available data) and Abstracts Views on Vision4Press platform.
Data correspond to usage on the plateform after 2015. The current usage metrics is available 48-96 hours after online publication and is updated daily on week days.
Initial download of the metrics may take a while.