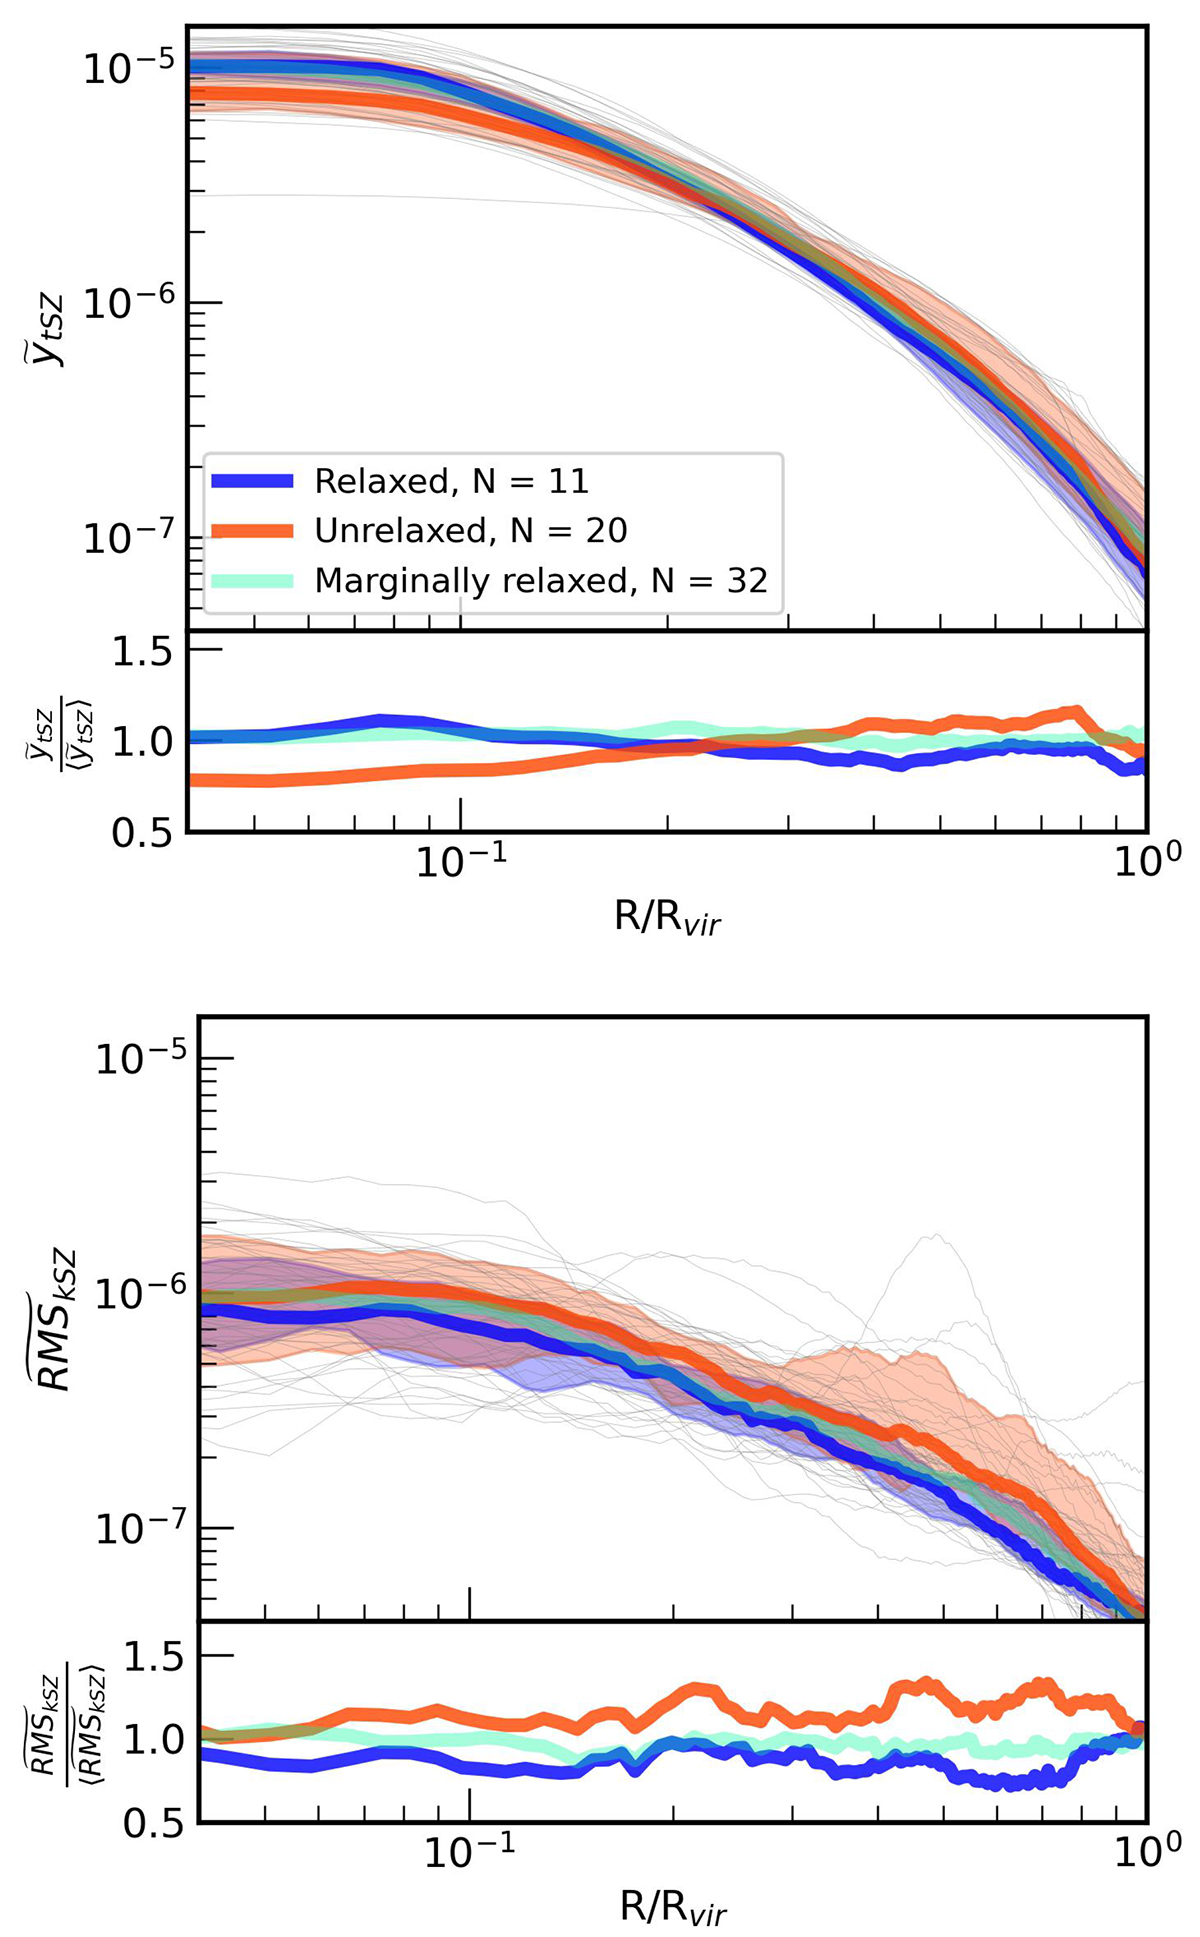
Fig. 7.
Download original image
Profiles at z = 0 of the y-parameter for the tSZ (top panel) and the kSZ (bottom panel) effects for different cluster populations. The thermal profile is obtained averaging over radial shells, whilst the kinetic profile is obtained computing its root mean square (RMS) in each shell. The solid lines represent the median of the profiles for each cluster population, whereas the shadowed areas correspond to a 68th percentile. All clusters are normalised to the same mass, Mvir = 1014 M⊙. Lower panels show the same quantity divided by the mean across the three dynamical state populations, thus highlighting the differences between them.
Current usage metrics show cumulative count of Article Views (full-text article views including HTML views, PDF and ePub downloads, according to the available data) and Abstracts Views on Vision4Press platform.
Data correspond to usage on the plateform after 2015. The current usage metrics is available 48-96 hours after online publication and is updated daily on week days.
Initial download of the metrics may take a while.