Fig. 3.
Download original image
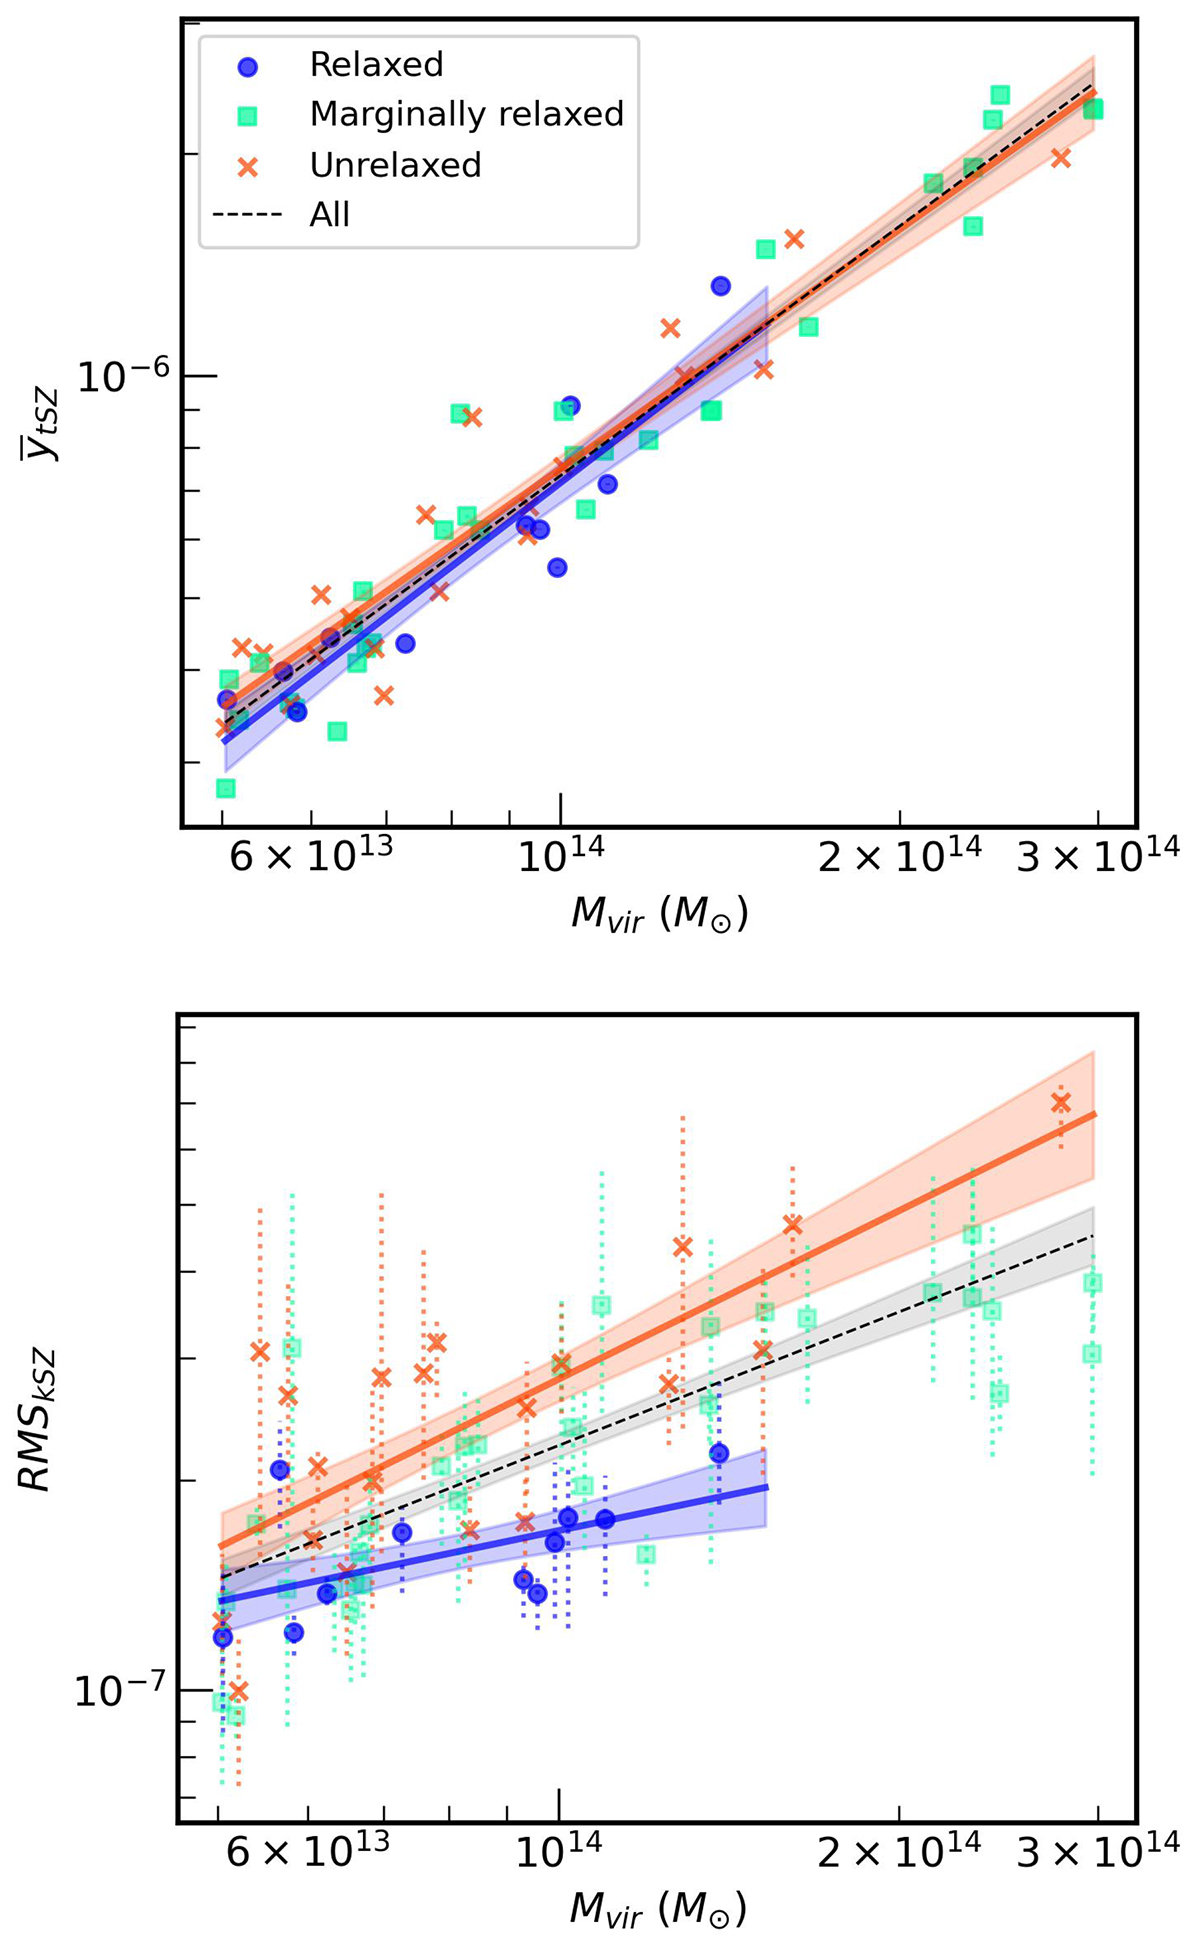
Scaling relation between the virial mass, Mvir, and the mean y-parameter for the tSZ effect (top panel) and for the RMS associated with the kSZ effect (bottom panel). The integration aperture is Rvir. The represented points correspond, for each cluster, to the mean across the three spatial projections. In both panels, the data have been fitted according to y = A(Mvir/M0)α, where M0 = 1014 M⊙ is the pivot mass and A is a normalisation. The best fitting parameters are presented in Table 1. The shaded regions correspond to the 16 − 84 confidence interval around the fit, whereas the error bars represent the variation (maximum and minimum values) across the three spatial projections for each cluster.
Current usage metrics show cumulative count of Article Views (full-text article views including HTML views, PDF and ePub downloads, according to the available data) and Abstracts Views on Vision4Press platform.
Data correspond to usage on the plateform after 2015. The current usage metrics is available 48-96 hours after online publication and is updated daily on week days.
Initial download of the metrics may take a while.