Fig. 11.
Download original image
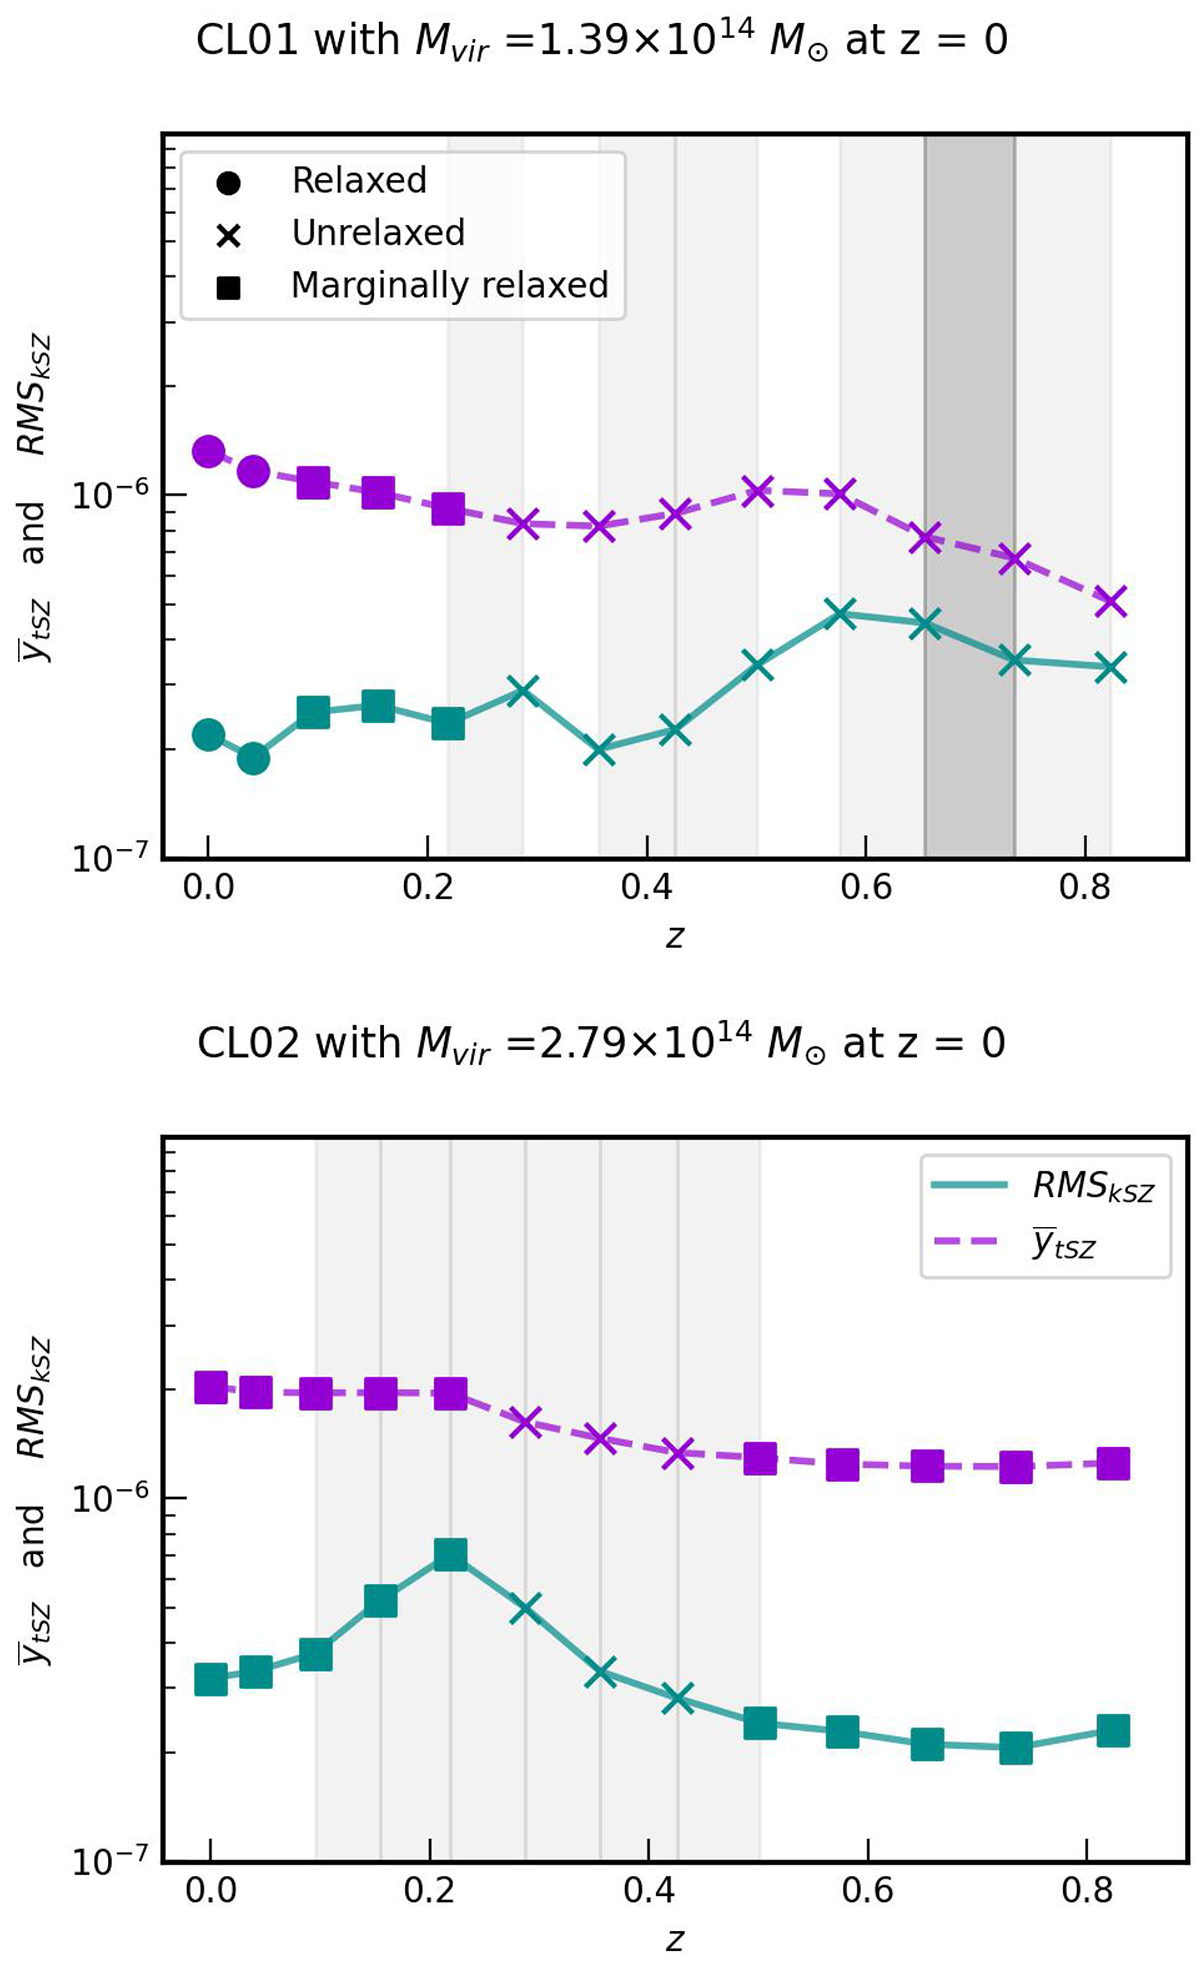
Individual evolution of two prototypical clusters in the sample, CL01 and CL02 (top and bottom panel, respectively). In green (purple) we plot the integrated RMS of the kSZ signal (tSZ signal) as a function of redshift. Different symbols differentiate between the three stages of dynamical state and we also show in light (dark) grey the minor (major) mergers. Major (minor) mergers are highlighted as dark (light) grey regions.
Current usage metrics show cumulative count of Article Views (full-text article views including HTML views, PDF and ePub downloads, according to the available data) and Abstracts Views on Vision4Press platform.
Data correspond to usage on the plateform after 2015. The current usage metrics is available 48-96 hours after online publication and is updated daily on week days.
Initial download of the metrics may take a while.