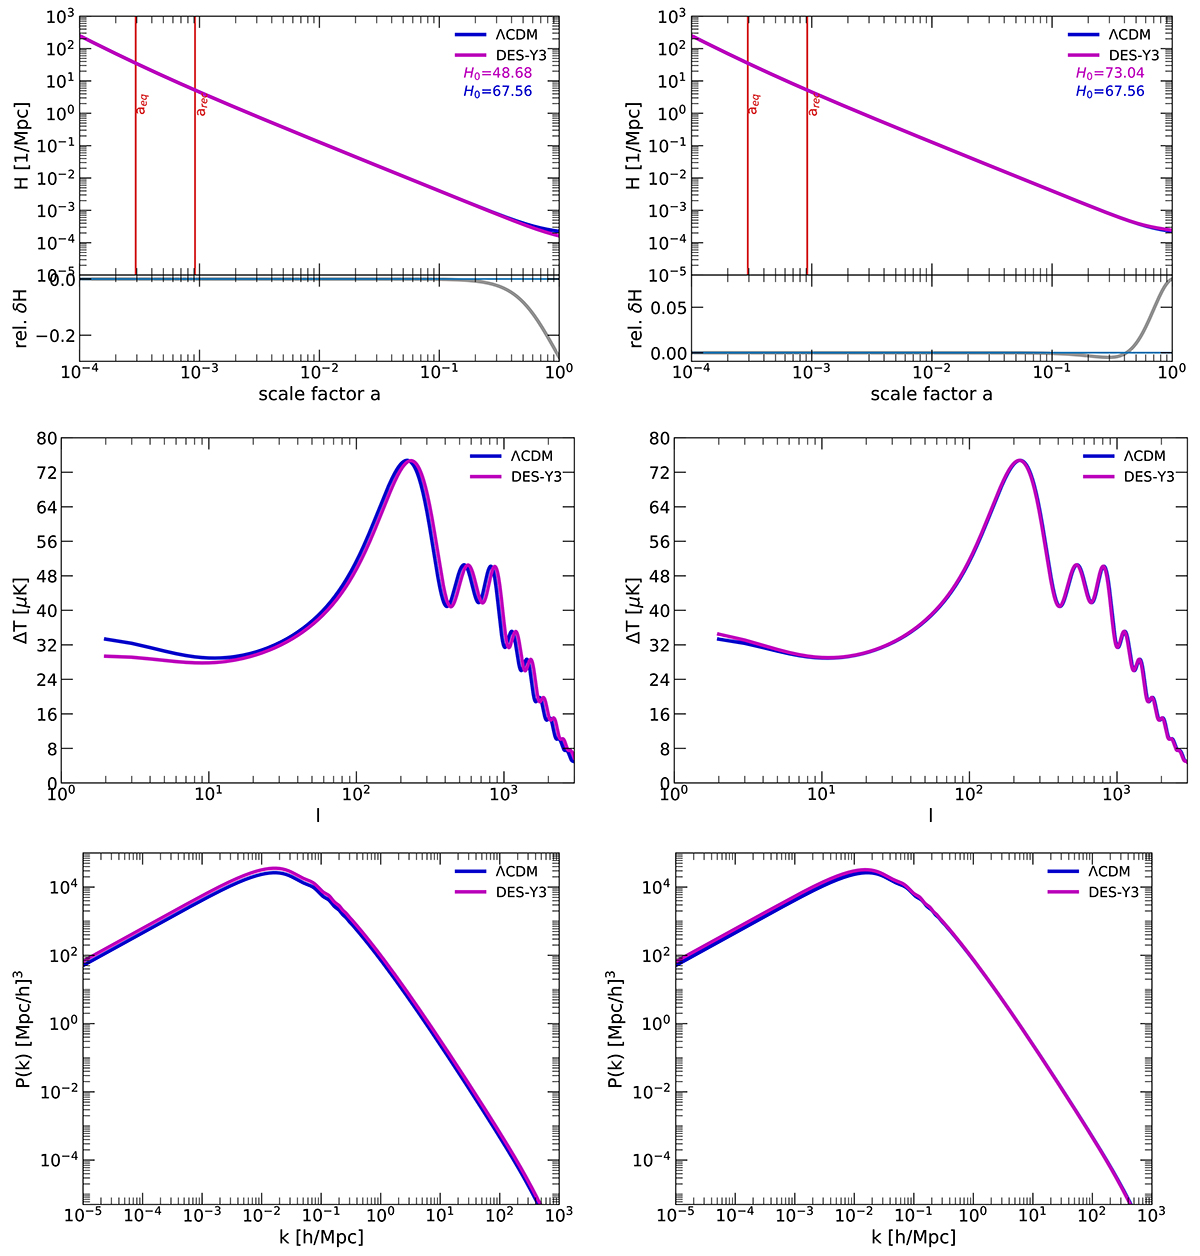
Fig. 8.
Download original image
DE component with increasing w: the DES-Y3 CPL model with w0 = −0.95 and wa = −0.4 (magenta) compared to ΛCDM (blue), both computed with our scheme. Panels on the left-hand column were computed using the early parametrization of H0 = 67.56 km s−1 Mpc−1 using Planck Collaboration VI (2020), while panels on the right-hand column employ the local parametrization of H0 = 73.04 km s−1 Mpc−1 from Riess et al. (2022). Top panels: expansion histories; for the vertical lines in red see Fig. 7. We note the deviations in the expansion histories from ΛCDM at late times (respective high scale factors) and the different run of these deviations (see gray curves in the bottom insets of the top panels). Middle panels: CMB temperature spectra. Bottom panels: matter power spectra. The results based on the CMB-determined H0, shown in the left-hand column, display a clear deviation from ΛCDM, whereas the results based on the locally determined H0 are in better agreement with ΛCDM.
Current usage metrics show cumulative count of Article Views (full-text article views including HTML views, PDF and ePub downloads, according to the available data) and Abstracts Views on Vision4Press platform.
Data correspond to usage on the plateform after 2015. The current usage metrics is available 48-96 hours after online publication and is updated daily on week days.
Initial download of the metrics may take a while.