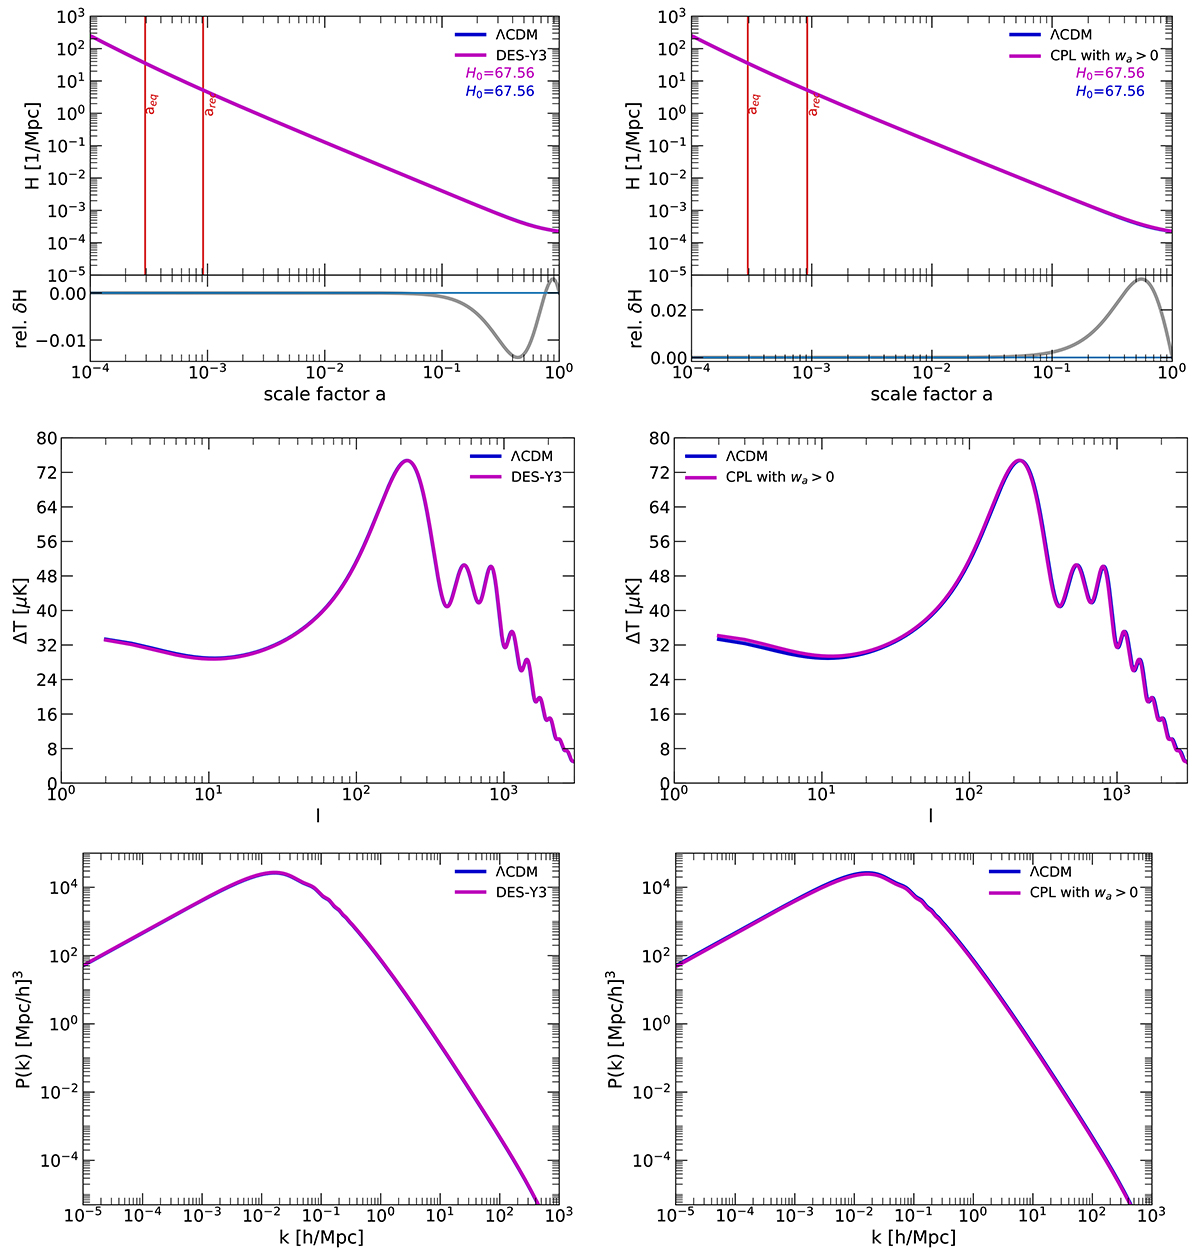
Fig. 7.
Download original image
CPL models (magenta) and ΛCDM (blue) both computed with the standard procedure. The left-hand side displays the results of the DES-Y3 CPL model with w0 = −0.95 and wa = −0.4. The right-hand side displays the results for the CPL model with w0 = −0.9 and wa = +0.1. We use the original version of CLASS and the value of H0, determined by CMB observations from Planck Collaboration VI (2020). The top panels display the expansion histories, where the vertical lines in red indicate the time of matter-radiation equality at scale factor aeq, followed by recombination arec (both determined by the cosmological model). The bottom insets show the relative deviation of the respective expansion histories (gray curve), which only matters at late times (respective high scale factors). The middle and bottom panels show the CMB temperature spectra (temperature anisotropies) as a function of mode number l, and the matter power spectra as a function of wave number k, respectively.
Current usage metrics show cumulative count of Article Views (full-text article views including HTML views, PDF and ePub downloads, according to the available data) and Abstracts Views on Vision4Press platform.
Data correspond to usage on the plateform after 2015. The current usage metrics is available 48-96 hours after online publication and is updated daily on week days.
Initial download of the metrics may take a while.