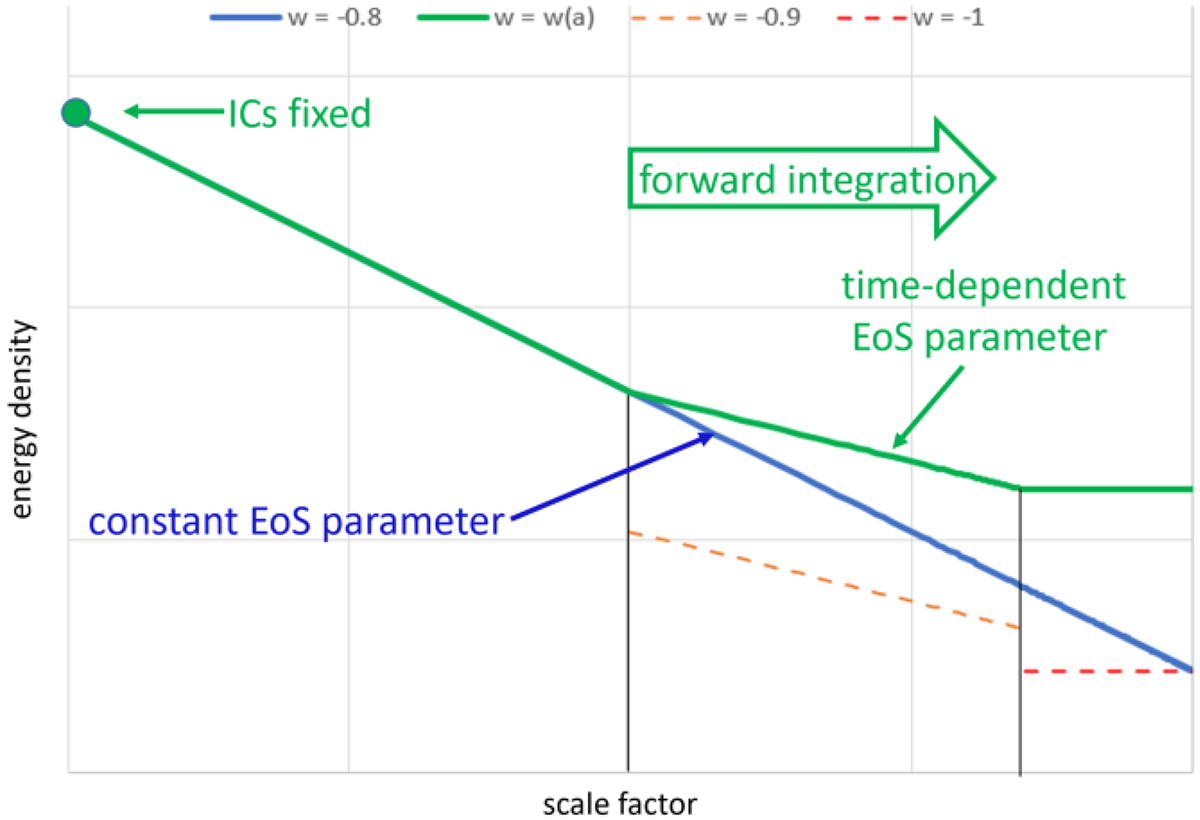
Fig. 2.
Download original image
Illustrative comparison between the evolution of energy density for a component with a constant or nonconstant EoS (arbitrary scaling). The blue component has a constant EoS parameter w = −0.8. The green component has a nonconstant EoS parameter w, which starts out with w = −0.8 (equal to the blue component) and evolves in two steps (indicated by the black vertical solid lines) to w = −0.9 (the slope is indicated by the dashed orange line) and finally to w = −1 (the slope is indicated by the dashed red line). The final density at the present time is higher for the green component.
Current usage metrics show cumulative count of Article Views (full-text article views including HTML views, PDF and ePub downloads, according to the available data) and Abstracts Views on Vision4Press platform.
Data correspond to usage on the plateform after 2015. The current usage metrics is available 48-96 hours after online publication and is updated daily on week days.
Initial download of the metrics may take a while.