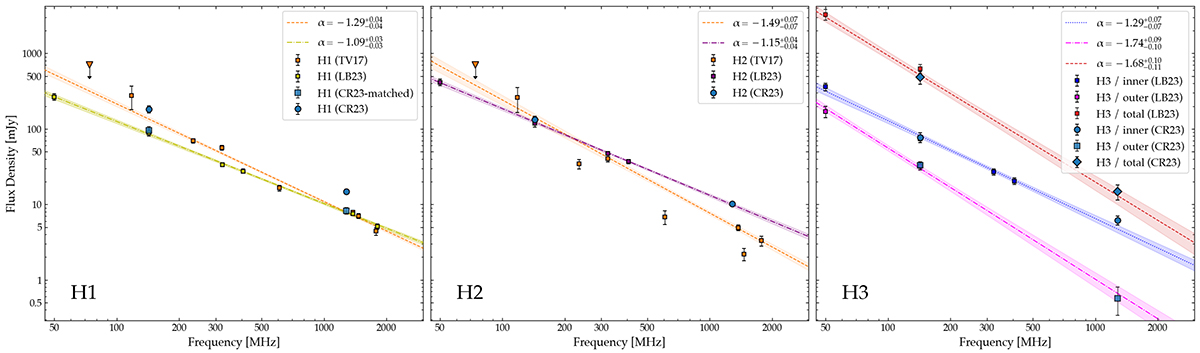
Fig. 7.
Download original image
Integrated spectral index measurements and fits for the three components: H1, H2, and H3. The measurements are presented in Table 2, with dashed, dotted, and dot-dashed lines indicating the best-fit spectral index, and the shaded region denoting the 1σ uncertainty, colourised according to the extraction region in Fig. 3. References “TV17”, “LB23” and “CR23” refer to Venturi et al. (2017), Bruno et al. (2023) and this work, respectively. Orange fits were performed solely on the measurements from Venturi et al. (2017), whereas the yellow and purple fits to H1 and H2, as well as all fits to H3, were performed using the combination of our new measurements plus those from Bruno et al. (2023). Note that the different sets of measurements for H1 were derived using different areas, as described in the text; the “CR23-matched” measurements denote those derived using the same region as Bruno et al. (2023), whereas the “CR23” measurement was derived over the more full extent of H1. When fitting to the data from Venturi et al. (2017), the 74 MHz measurement for H1 and H2 is an upper limit and was thus excluded from the fit. Likewise, the measurements at 234 MHz, 608 MHz, and 1377 MHz for H2 were derived from data with sparser uv-coverage, and were excluded from the fit. See Venturi et al. (2017) for further details.
Current usage metrics show cumulative count of Article Views (full-text article views including HTML views, PDF and ePub downloads, according to the available data) and Abstracts Views on Vision4Press platform.
Data correspond to usage on the plateform after 2015. The current usage metrics is available 48-96 hours after online publication and is updated daily on week days.
Initial download of the metrics may take a while.