Fig. 3.
Download original image
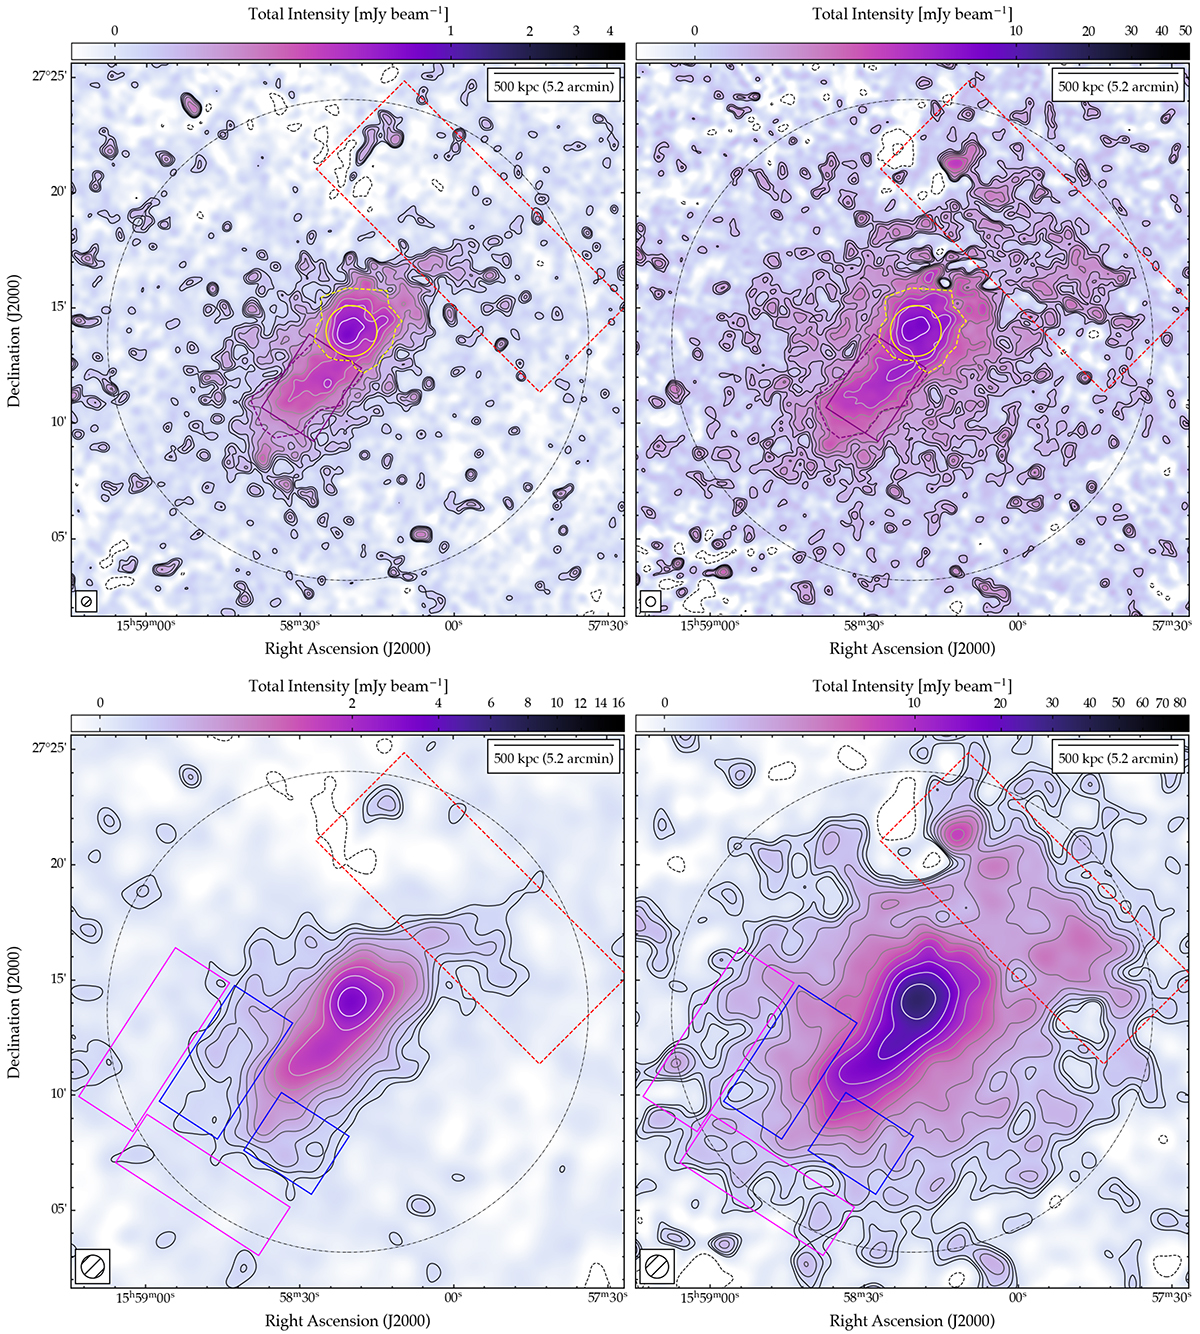
Source-subtracted radio continuum images of Abell 2142 with MeerKAT at 1283 MHz (left) and LOFAR at 143 MHz (right), shown at 25 arcesc resolution (top) and 60 arcsec resolution (bottom). Colourscale ranges from −2σ to 300σ on an arcsinh stretch to emphasise diffuse emission. The first contour is shown at the 2σ level, then contours scale by a factor of ![]() from 3σ, where σ = 15 (172) μJy beam−1 at 1283 MHz (143 MHz). Dashed contour denotes the −3σ level. The dot-dashed circle traces a radius of 1 Mpc around the centre of Abell 2142. Note that all discrete sources have been subtracted from the visibilities before imaging, as described in the text. Solid-line boxes and dashed polygons denote the areas used to measure the flux of the H1 (yellow), H2 (purple), and H3 (blue and magenta) as described later in the text. Dashed red box indicates regions where residuals from T1 and T2 are significant, and as such are excluded from later analysis.
from 3σ, where σ = 15 (172) μJy beam−1 at 1283 MHz (143 MHz). Dashed contour denotes the −3σ level. The dot-dashed circle traces a radius of 1 Mpc around the centre of Abell 2142. Note that all discrete sources have been subtracted from the visibilities before imaging, as described in the text. Solid-line boxes and dashed polygons denote the areas used to measure the flux of the H1 (yellow), H2 (purple), and H3 (blue and magenta) as described later in the text. Dashed red box indicates regions where residuals from T1 and T2 are significant, and as such are excluded from later analysis.
Current usage metrics show cumulative count of Article Views (full-text article views including HTML views, PDF and ePub downloads, according to the available data) and Abstracts Views on Vision4Press platform.
Data correspond to usage on the plateform after 2015. The current usage metrics is available 48-96 hours after online publication and is updated daily on week days.
Initial download of the metrics may take a while.