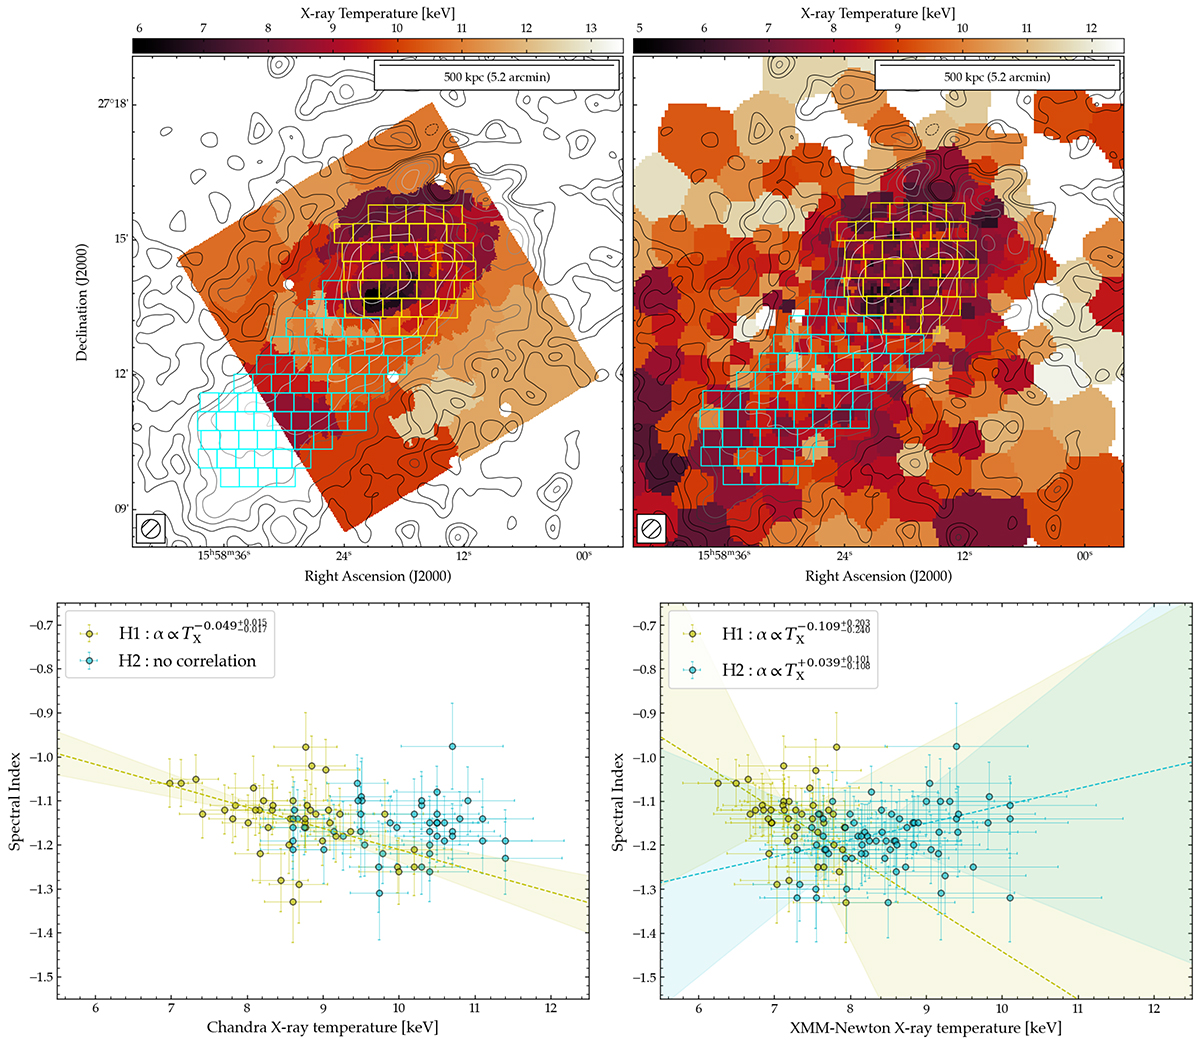
Fig. 14.
Download original image
Point-to-point correlation between radio spectral index and X-ray temperature for Abell 2142. The upper row shows X-ray temperature maps derived from Chandra (left) and XMM-Newton (right) observations, with contours showing 143 MHz LOFAR data at 25 arcsec resolution. Coloured boxes show the regions covering H1 (yellow) and H2 (cyan) used to probe the α/TX correlation. The lower panels show the point-to-point correlation between radio spectral index and X-ray temperature measured by Chandra (left) and XMM-Newton (right). The dashed lines indicate the best-fit relation, with the shaded region denoting the 1σ uncertainty; the slopes are shown in the inset in each subplot.
Current usage metrics show cumulative count of Article Views (full-text article views including HTML views, PDF and ePub downloads, according to the available data) and Abstracts Views on Vision4Press platform.
Data correspond to usage on the plateform after 2015. The current usage metrics is available 48-96 hours after online publication and is updated daily on week days.
Initial download of the metrics may take a while.