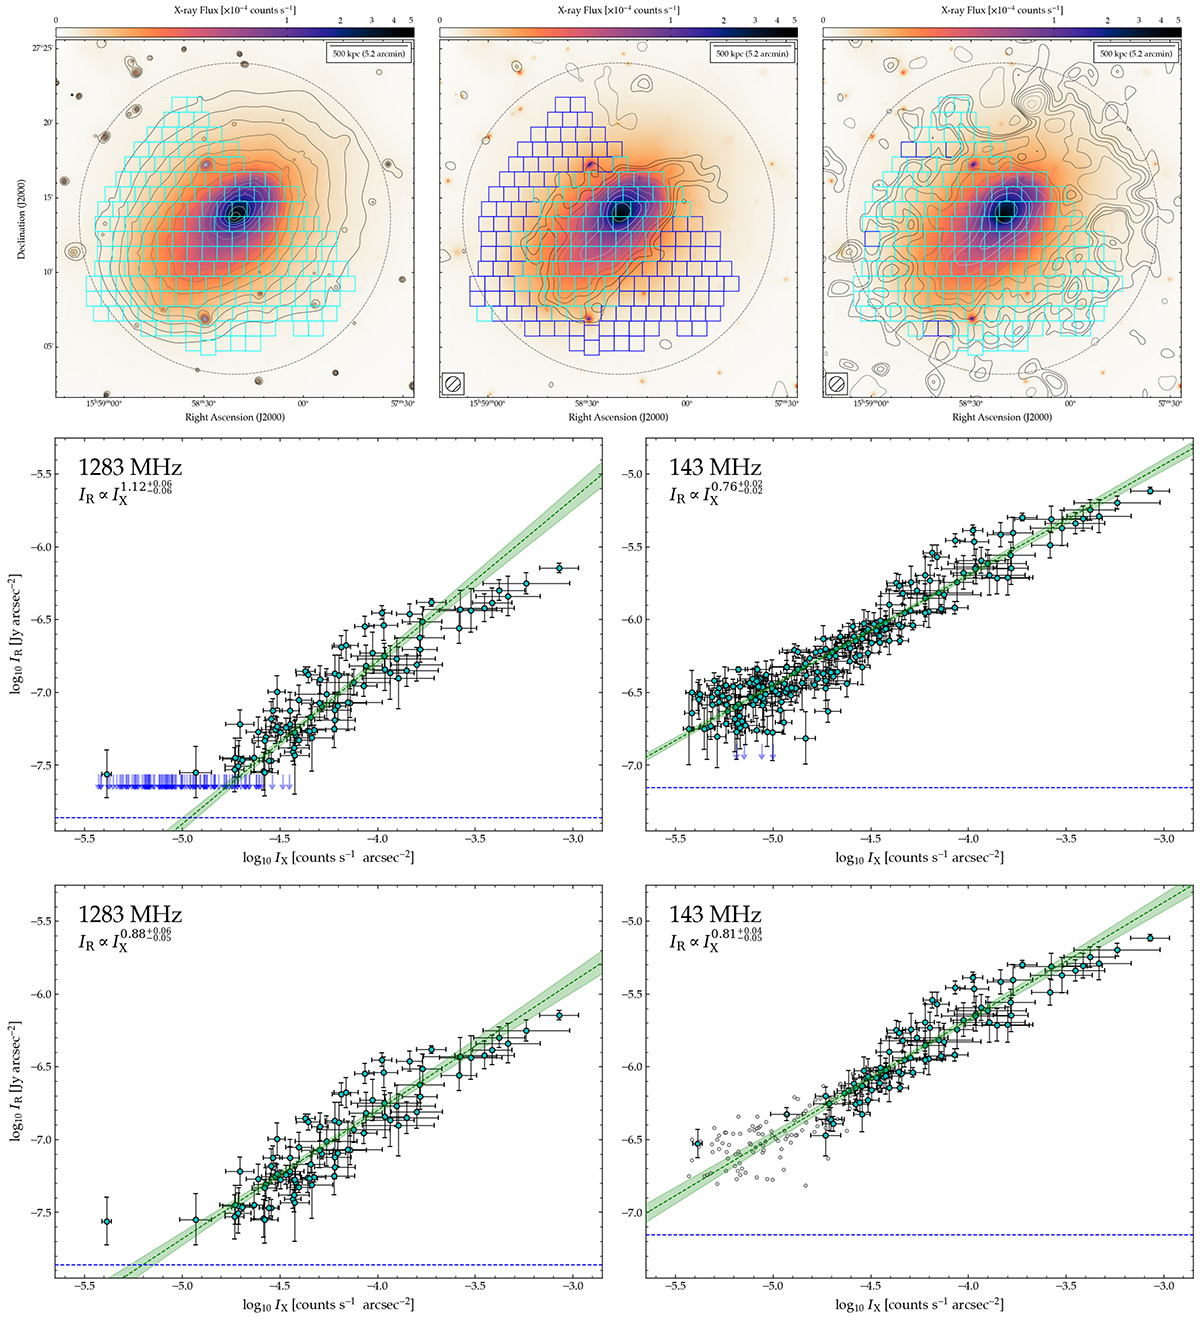
Fig. 11.
Download original image
Point-to-point correlation between radio and X-ray surface brightness (IR/IX) for Abell 2142. Upper row shows the regions used to extract the surface brightness measurements. Colourscale is the XMM-Newton surface brightness, with contours showing surface brightness measured by XMM-Newton, MeerKAT and LOFAR from left to right. Boxes are colourised according to whether the surface brightness within is considered a measurement (cyan) or a 2σ limit (blue). Middle and lower rows show the IR/IX correlation plane at 1283 MHz (left) and 143 MHz (right) at 60 arcsec resolution. The dashed blue line indicates the 1σ level. Dashed green line shows the best-fit power-law relation and 1σ uncertainty region shown shaded. The slope is indicated in the upper-left corner inset. The lower panels show the results using a common region set where both MeerKAT and LOFAR measure a radio surface brightness of at least 2σ (cyan markers); open datapoints indicate measurements excluded from the fit.
Current usage metrics show cumulative count of Article Views (full-text article views including HTML views, PDF and ePub downloads, according to the available data) and Abstracts Views on Vision4Press platform.
Data correspond to usage on the plateform after 2015. The current usage metrics is available 48-96 hours after online publication and is updated daily on week days.
Initial download of the metrics may take a while.