Fig. 10.
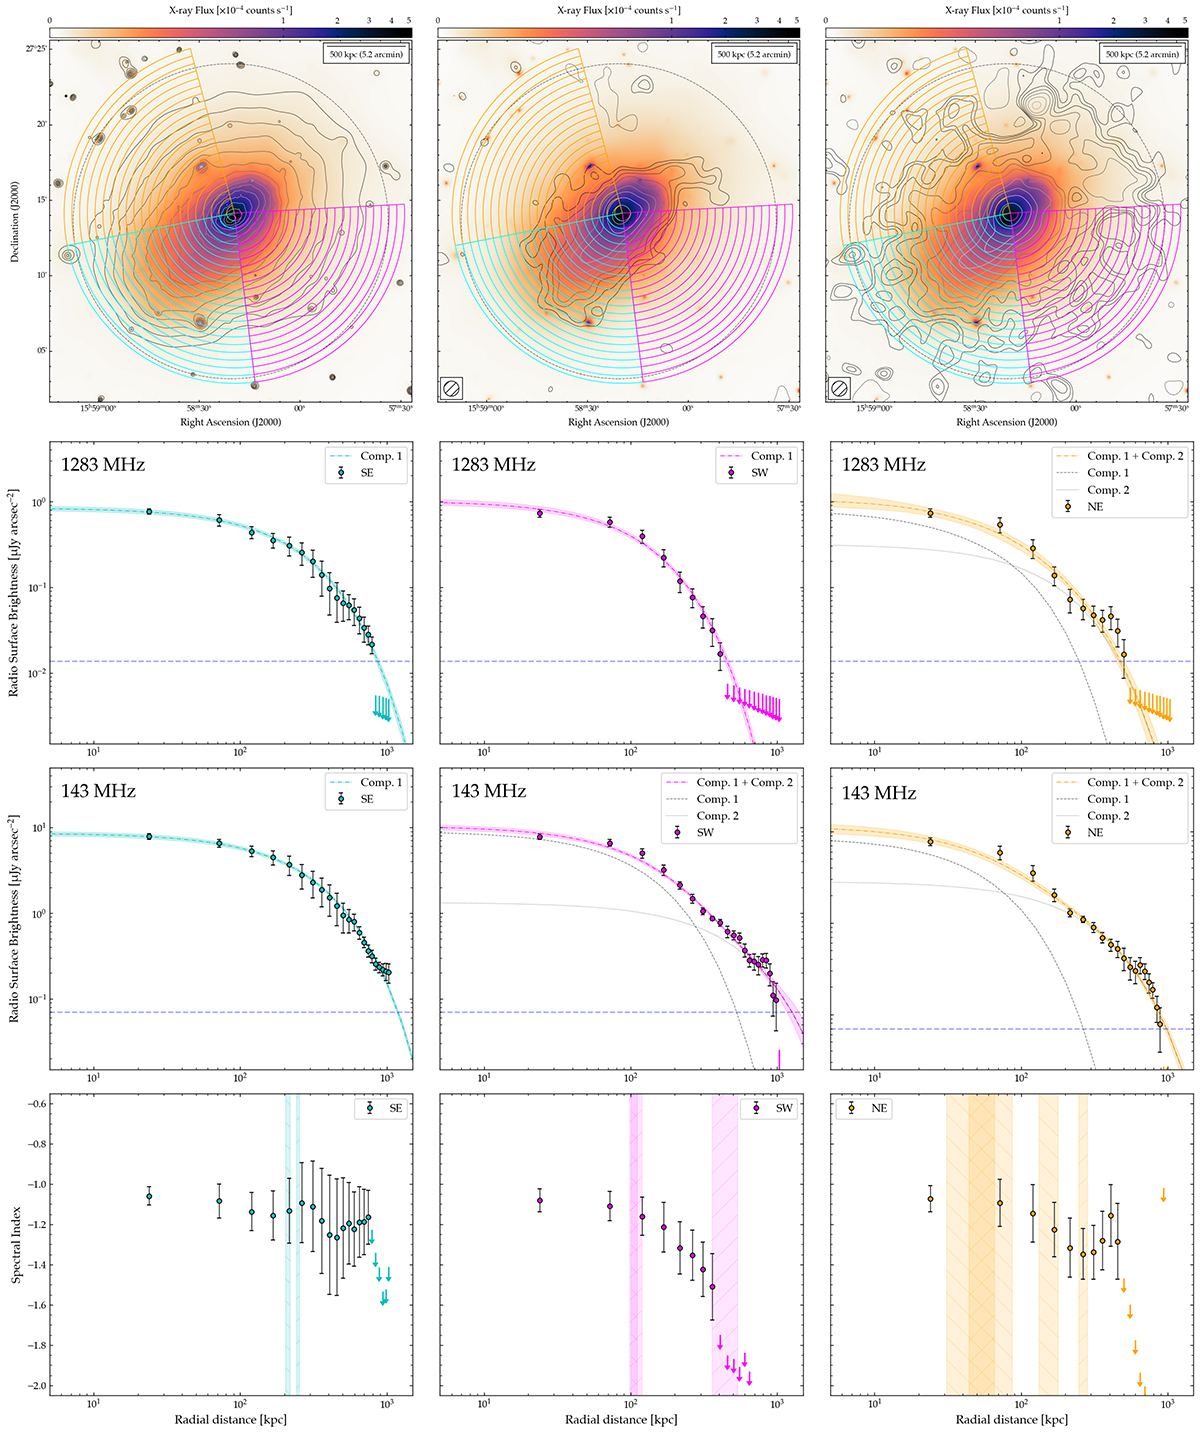
Download original image
Radial profiles for the multi-component halo in Abell 2142 at 60 arcsec resolution. The upper row shows the wedge-shaped regions used to trace the profiles in three directions. Profiles are shown at 1283 MHz and 143 MHz, with datapoints showing measurements and arrows denoting 1σ upper limits. The uncertainties show only statistical errors, and the horizontal dashed line indicates the 1σ level. Colourised dot-dashed curves show fits to the data, which describe either a single- or double-component circular exponential profile described in Eq. (2), with best-fit parameters presented in Table 3. Where the two-component model provides a better description of our data, we show each component individually using dashed and dotted curves. The lower panels show the radial spectral index profile derived using the average surface brightness in each region at 1283 MHz and 143 MHz, with 3σ upper limits shown as arrows. Uncertainties include both statistical and systematic uncertainties. Shaded regions show the characteristic e-folding radius of each component, as plotted above and shown in Table 3.
Current usage metrics show cumulative count of Article Views (full-text article views including HTML views, PDF and ePub downloads, according to the available data) and Abstracts Views on Vision4Press platform.
Data correspond to usage on the plateform after 2015. The current usage metrics is available 48-96 hours after online publication and is updated daily on week days.
Initial download of the metrics may take a while.