Fig. 1.
Download original image
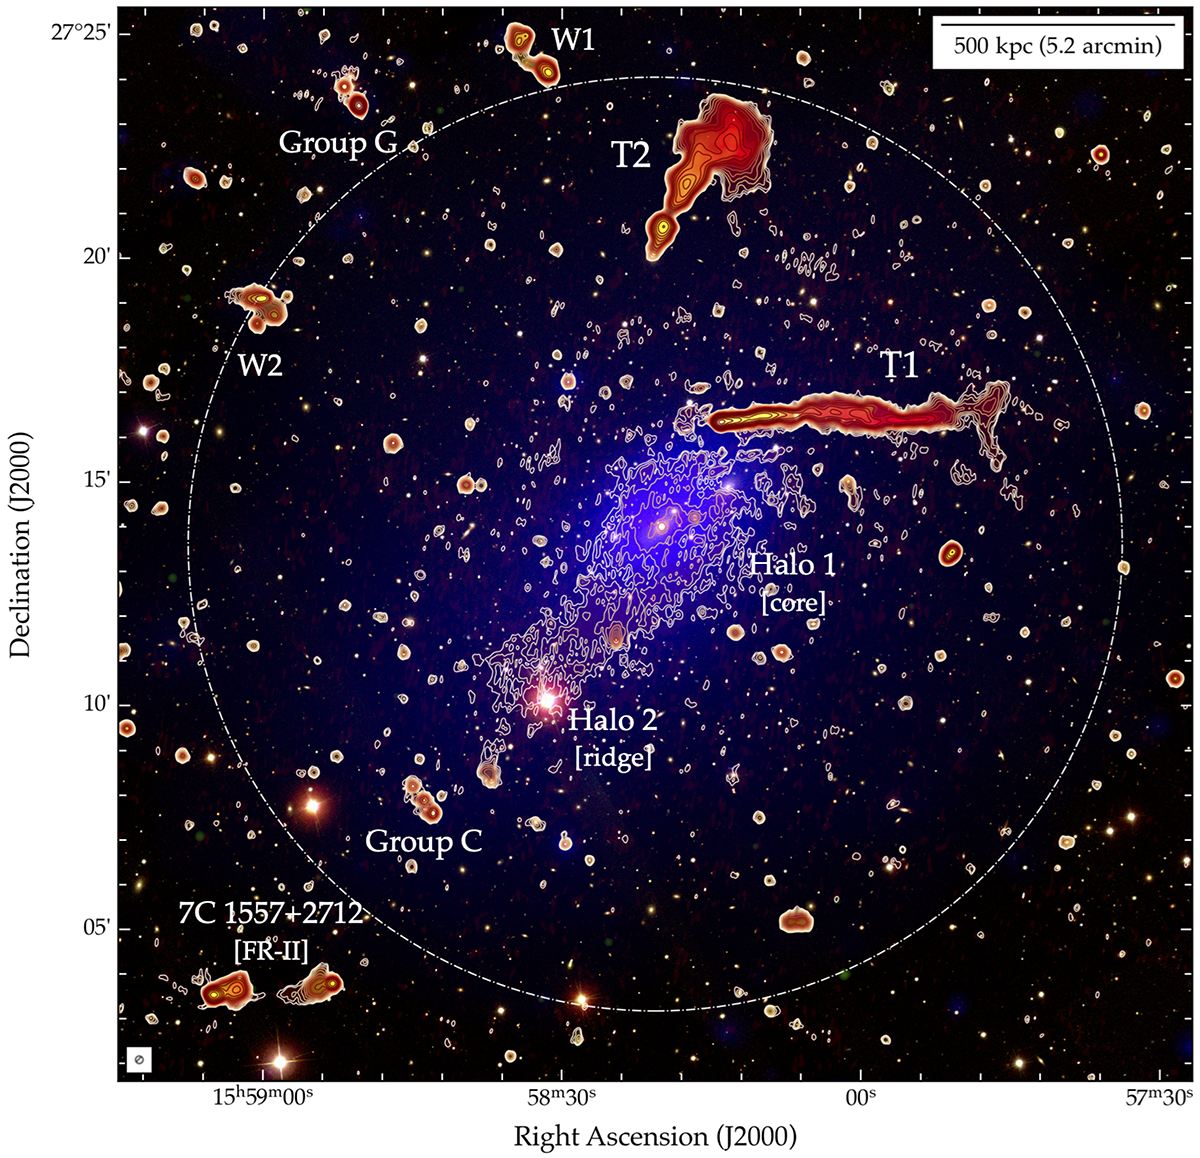
Colour-composite image of Abell 2142, overlaying radio colour on optical RGB. Optical RGB image comprises i-, r- and g-bands from the SDSS. Yellow-through-red colours trace the radio surface brightness measured by LOFAR at 143 MHz and MeerKAT at 1283 MHz, both shown at 10 arcsec resolution (indicated by the hatched circle in the lower-left corner), with redder colours denoting increasingly steep-spectrum synchrotron emission. Contours trace the LOFAR surface brightness starting at 4σ and scaling by a factor of ![]() . Blue colours trace the thermal ICM plasma measured by XMM-Newton, adaptively smoothed to enhance low surface brightness emission. Known features are identified following the established nomenclature (Venturi et al. 2017; Bruno et al. 2023). The dot-dashed circle indicates a radius of 1 Mpc centred on the cluster centre.
. Blue colours trace the thermal ICM plasma measured by XMM-Newton, adaptively smoothed to enhance low surface brightness emission. Known features are identified following the established nomenclature (Venturi et al. 2017; Bruno et al. 2023). The dot-dashed circle indicates a radius of 1 Mpc centred on the cluster centre.
Current usage metrics show cumulative count of Article Views (full-text article views including HTML views, PDF and ePub downloads, according to the available data) and Abstracts Views on Vision4Press platform.
Data correspond to usage on the plateform after 2015. The current usage metrics is available 48-96 hours after online publication and is updated daily on week days.
Initial download of the metrics may take a while.