Open Access
Fig. 9.
Download original image
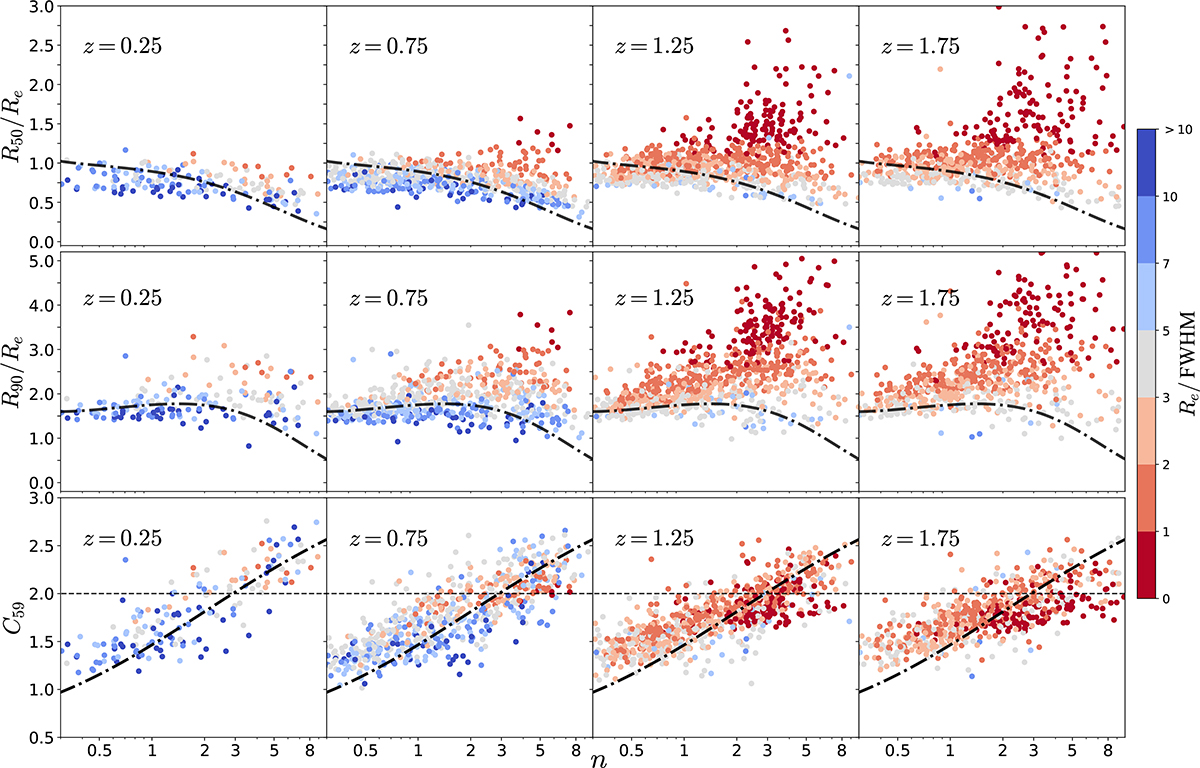
R50/Re, R90/Re, and C59 as a function of the Sérsic index n for the EGS images at 0 < z < 2. The dot-dashed black curve in each panel is the numerical correlations derived by integrating the Sérsic profile. In the bottom row, the horizontal dashed line C59 = 2 indicates the empirical boundary between spheroids and discs.
Current usage metrics show cumulative count of Article Views (full-text article views including HTML views, PDF and ePub downloads, according to the available data) and Abstracts Views on Vision4Press platform.
Data correspond to usage on the plateform after 2015. The current usage metrics is available 48-96 hours after online publication and is updated daily on week days.
Initial download of the metrics may take a while.