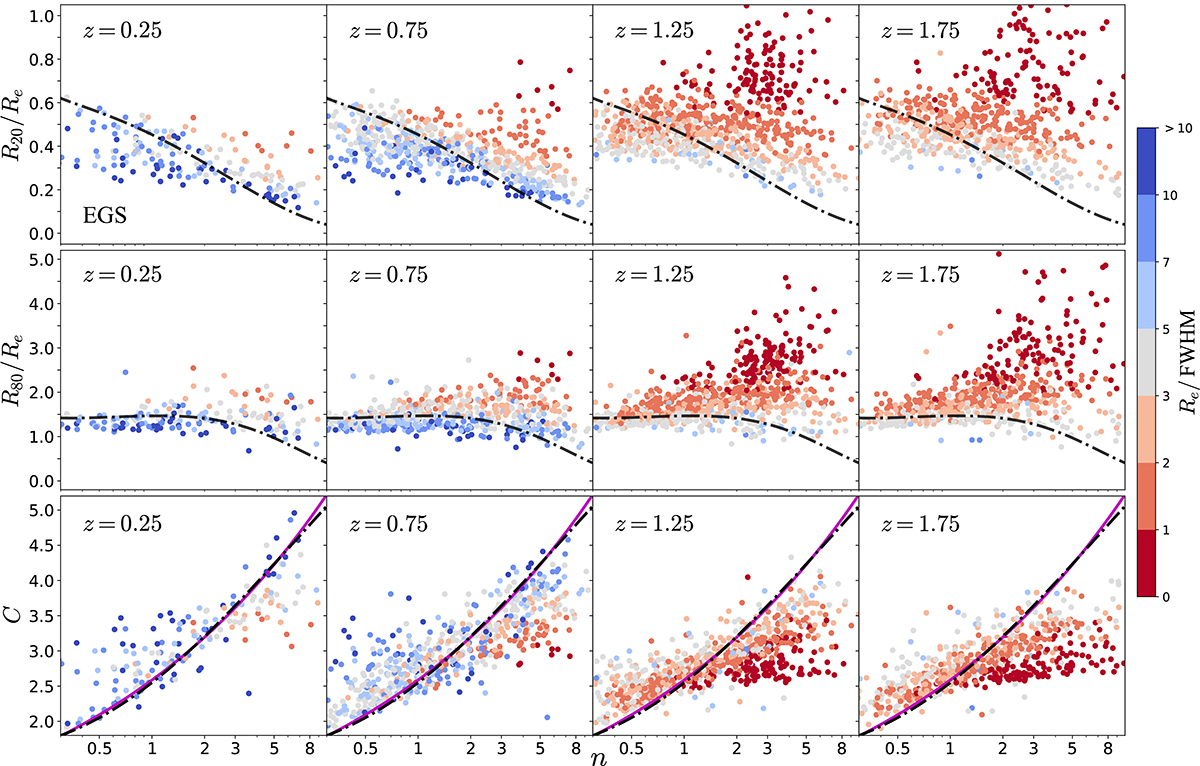
Fig. 7.
Download original image
R20/Re, R80/Re, and C as the Sérsic index a function of n for the EGS images at 0 < z < 2. The dot-dashed black curve in each panel represents the numerical correlations derived by integrating the Sérsic profile. In the bottom row, the solid purple curve is the empirical relation of Eq. (5) given by Andrae et al. (2011). The colour of the points marks the relative sizes of the galaxies with Re/FWHM.
Current usage metrics show cumulative count of Article Views (full-text article views including HTML views, PDF and ePub downloads, according to the available data) and Abstracts Views on Vision4Press platform.
Data correspond to usage on the plateform after 2015. The current usage metrics is available 48-96 hours after online publication and is updated daily on week days.
Initial download of the metrics may take a while.