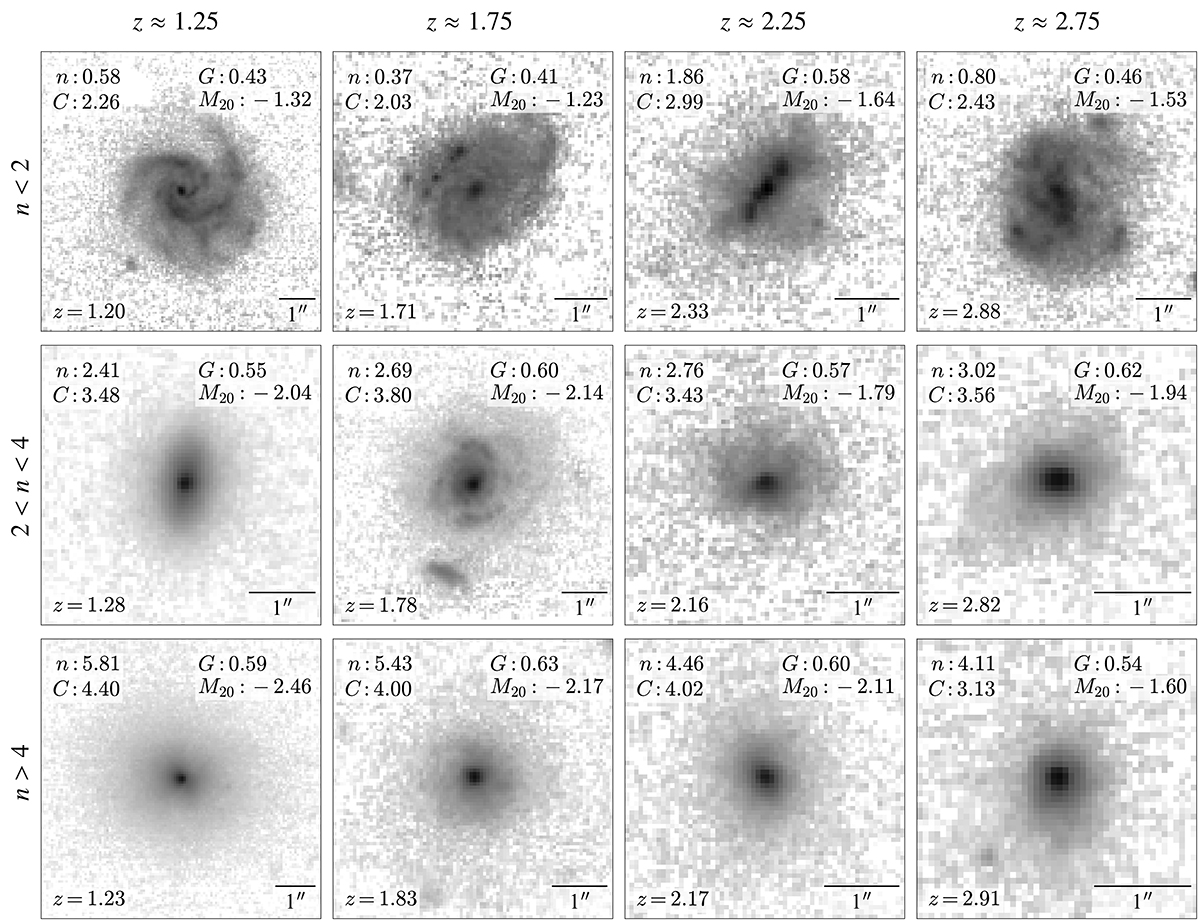
Fig. 6.
Download original image
Examples of galaxies in the CEERS images, with the Sérsic index increasing from the top to bottom rows (disc to spheroid morphology) and the redshift increasing (from z ≈ 1 to 3) from the left to right columns. The structural parameters are also listed in each panel. The galaxies on the left two columns are also shown in the same as ones in the right two columns of Fig. 5 for the HST observation. Due to the higher resolution and S/N of images in JWST, the galaxies exhibit more details, resulting in higher values of C, G, and |M20| for galaxies with n > 2.
Current usage metrics show cumulative count of Article Views (full-text article views including HTML views, PDF and ePub downloads, according to the available data) and Abstracts Views on Vision4Press platform.
Data correspond to usage on the plateform after 2015. The current usage metrics is available 48-96 hours after online publication and is updated daily on week days.
Initial download of the metrics may take a while.